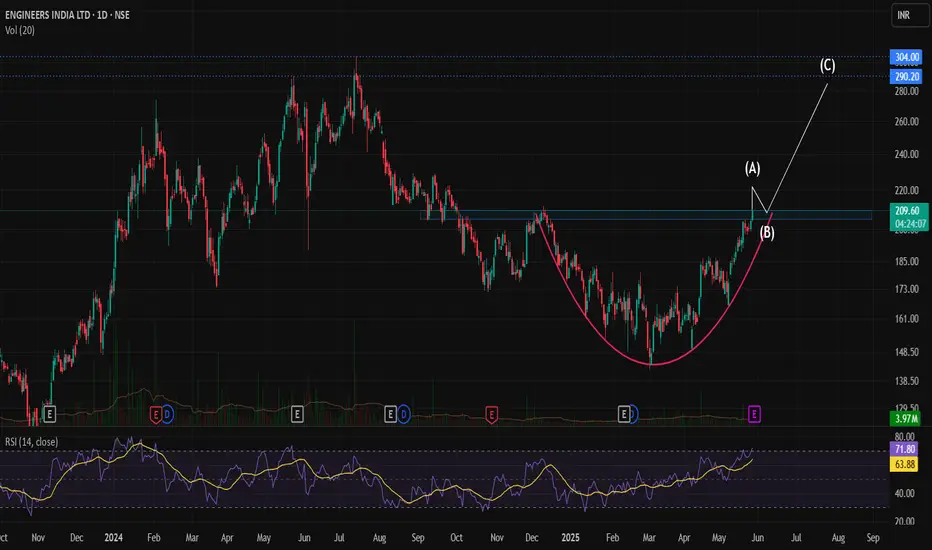
Engineers India Price Analysis for Dec 2025 to Mar 2026Stock has shown support in 166-175 region during Mar - Apr 2025 period. It went on to reach a high of 250 by mid-july 2025.
It is likely to take support as the uptrend trendline and support area are likely to converge again anytime during the period Dec 2025 to Mar 2026. As shown in the chart.
Entry
Engineers India Limited
No trades
Next report date
—
Report period
—
EPS estimate
—
Revenue estimate
—
9.56 INR
5.80 B INR
30.88 B INR
273.36 M
About Engineers India Limited
Sector
Industry
CEO
Vartika Shukla
Website
Headquarters
New Delhi
Founded
1972
Identifiers
2
ISININE510A01028
Engineers India Ltd. engages in providing engineering, technical, and consultancy services. The firm operates through the following segments: Consultancy & Engineering Projects and Turnkey Projects. The company was founded on March 15, 1965 and is headquartered in New Delhi, India.
Related stocks

EIL has come out its consolidation range and ready to riseEIL has come out its weekly consolidation range and ready to resume its upward journey. Hard stop loss below 190. Buy around 198 and hold till it reaches 240-260 range and trail with 20 points stoploss

Technical View: Engineers India Ltd (EIL)Pattern Formation
The stock is moving inside a sideways accumulation range between ₹188–₹200.
Multiple swing highs formed in the ₹212–₹220 region created a liquidity pool.
Price repeatedly wicked above these highs, indicating Buy-Side Liquidity Hunt.
Breakout Behaviour
A strong bullish

Engineers India Limited Cypher Pattern & Buy OpportunityTechnical analysis indicates formation of a Gartley Cypher pattern, signaling a potential bullish reversal for EIL.
The stock has declined nearly 50% recently, creating an attractive entry point.
Strong support found around the 170 INR level, serving as a critical buying zone.
Target price expect

PSE: ENGINERSIN (ENGINEERS INDIA LTD.): BIGGER PICTURE ANALYSIS LTP:190.xx
Supports: 142/92/55/50
Resistances: 256/304
As long as the above supports hold, we can see 244 first.
Further targets: 289-300, 325, 380, 434.


Engineers India – Bullish Breakout AlertEngineers India – Bullish Breakout Alert!
Timeframe: Daily | CMP: ₹222.50 | Outlook: Strong Upside Potential (Next 15 Days)
📈 Technical Setup
Engineers India is showing a bullish breakout from a multi-week rounding bottom / flag formation with strong volume confirmation.
✅ Breakout Level: ₹224 (da

Engineers India Ltd: Breakout Confirmed, But Is It Time to Ente?Engineers India Ltd has broken out of a narrow consolidation range, showing strong bullish intent. The breakout is supported by a Golden Cross — where the 50-day moving average has crossed above the 200-day moving average, a classic signal for long-term strength.
However, the RSI is currently in th

Engineers IndiaBullish RD on Monthly Time Frame.
Weekly Bollinger Band Challenge on the upside with the monthly MACD Uptick above Zero Line and Weekly RSI & Stoch is in momentum. Adx is rising with +DI -DI Positive Cross Over.
Target as per my technical analysis is 298 - 340 - 394

Rounding bottom pattern in Engineers IndiaRounding bottom pattern formed in Engineers India. After breakout, it can extend its move to 260, 290 and 300 in the mid to long term.
See all ideas
Summarizing what the indicators are suggesting.
Neutral
SellBuy
Strong sellStrong buy
Strong sellSellNeutralBuyStrong buy
Neutral
SellBuy
Strong sellStrong buy
Strong sellSellNeutralBuyStrong buy
Neutral
SellBuy
Strong sellStrong buy
Strong sellSellNeutralBuyStrong buy
An aggregate view of professional's ratings.
Neutral
SellBuy
Strong sellStrong buy
Strong sellSellNeutralBuyStrong buy
Neutral
SellBuy
Strong sellStrong buy
Strong sellSellNeutralBuyStrong buy
Neutral
SellBuy
Strong sellStrong buy
Strong sellSellNeutralBuyStrong buy
Displays a symbol's price movements over previous years to identify recurring trends.
SMALLCAP
Mirae Asset Nifty Smallcap 250 Momentum Quality 100 ETF Units Exchange Traded FundWeight
0.63%
Market value
504.30 K
USD
Explore more ETFs
Frequently Asked Questions
The current price of ENGINERSIN is 199.87 INR — it has increased by 0.55% in the past 24 hours. Watch Engineers India Limited stock price performance more closely on the chart.
Depending on the exchange, the stock ticker may vary. For instance, on NSE exchange Engineers India Limited stocks are traded under the ticker ENGINERSIN.
ENGINERSIN stock has risen by 3.45% compared to the previous week, the month change is a 1.41% rise, over the last year Engineers India Limited has showed a 6.31% increase.
We've gathered analysts' opinions on Engineers India Limited future price: according to them, ENGINERSIN price has a max estimate of 285.00 INR and a min estimate of 205.00 INR. Watch ENGINERSIN chart and read a more detailed Engineers India Limited stock forecast: see what analysts think of Engineers India Limited and suggest that you do with its stocks.
ENGINERSIN reached its all-time high on Jul 12, 2024 with the price of 303.90 INR, and its all-time low was 4.85 INR and was reached on Sep 17, 2001. View more price dynamics on ENGINERSIN chart.
See other stocks reaching their highest and lowest prices.
See other stocks reaching their highest and lowest prices.
ENGINERSIN stock is 1.93% volatile and has beta coefficient of 1.54. Track Engineers India Limited stock price on the chart and check out the list of the most volatile stocks — is Engineers India Limited there?
Today Engineers India Limited has the market capitalization of 111.93 B, it has increased by 0.96% over the last week.
Yes, you can track Engineers India Limited financials in yearly and quarterly reports right on TradingView.
Engineers India Limited is going to release the next earnings report on Feb 11, 2026. Keep track of upcoming events with our Earnings Calendar.
ENGINERSIN net income for the last quarter is 834.87 M INR, while the quarter before that showed 654.01 M INR of net income which accounts for 27.65% change. Track more Engineers India Limited financial stats to get the full picture.
Engineers India Limited dividend yield was 2.49% in 2024, and payout ratio reached 38.78%. The year before the numbers were 1.49% and 37.87% correspondingly. See high-dividend stocks and find more opportunities for your portfolio.
As of Dec 24, 2025, the company has 2.65 K employees. See our rating of the largest employees — is Engineers India Limited on this list?
EBITDA measures a company's operating performance, its growth signifies an improvement in the efficiency of a company. Engineers India Limited EBITDA is 5.91 B INR, and current EBITDA margin is 16.95%. See more stats in Engineers India Limited financial statements.
Like other stocks, ENGINERSIN shares are traded on stock exchanges, e.g. Nasdaq, Nyse, Euronext, and the easiest way to buy them is through an online stock broker. To do this, you need to open an account and follow a broker's procedures, then start trading. You can trade Engineers India Limited stock right from TradingView charts — choose your broker and connect to your account.
Investing in stocks requires a comprehensive research: you should carefully study all the available data, e.g. company's financials, related news, and its technical analysis. So Engineers India Limited technincal analysis shows the buy rating today, and its 1 week rating is buy. Since market conditions are prone to changes, it's worth looking a bit further into the future — according to the 1 month rating Engineers India Limited stock shows the buy signal. See more of Engineers India Limited technicals for a more comprehensive analysis.
If you're still not sure, try looking for inspiration in our curated watchlists.
If you're still not sure, try looking for inspiration in our curated watchlists.