ESAFSFB LONGElliott Wave analysis shows that the stock has completed waves a, b, and c as a correction since its initial public offering. Currently, the stock is undergoing an impulse wave.
The stock is currently in wave (ii) and retraced 61.8% of wave (i) shows a blue color.
Wave (iii) is about to start.
RSI is above 40 i.e. is a bullish sign
Stochastic also showed a bullish crossover.
It is anticipated that wave (iii) will have about five subdivisions shown in red colour.
Wave levels are shown on the chart.
Falling wedge formation on the chart. (The falling wedge is a bullish reversal pattern)
On the downturn (dip), there is a probability of making a buy.
Level of Invalidation
The starting point of Wave (i) has been identified as the invalidation level at 49. Because as per wave rules Wave (ii) cannot retrace more than 100% of Wave (i). If the price falls below this level, it can indicate that the expected Elliott Wave pattern is not as it seems.
I am not a registered Sebi analyst. My research is being done only for academic interests.
Please speak with your financial advisor before trading or making any investments. I take no responsibility whatsoever for your gains or losses.
Regards
VJ
ESAFSFB trade ideas

BUY TODAY SELL TOMORROW for 5%DON’T HAVE TIME TO MANAGE YOUR TRADES?
- Take BTST trades at 3:25 pm every day
- Try to exit by taking 4-7% profit of each trade
- SL can also be maintained as closing below the low of the breakout candle
Now, why do I prefer BTST over swing trades? The primary reason is that I have observed that 90% of the stocks give most of the movement in just 1-2 days and the rest of the time they either consolidate or fall
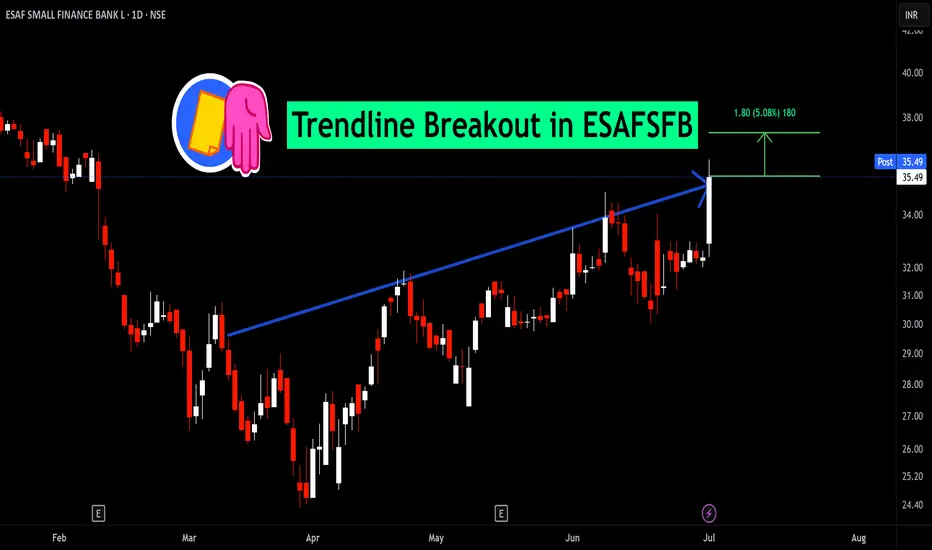
Trendline Breakout in ESAFSFB
BUY TODAY SELL TOMORROW for 5%
ESAFSFB, Good For Long (Daily Chart)CMP -50
Entry Price - 50-51
SL- 48 (Day Closing Basis)
Holding Time- As much as you can .
Chart Type - Daily
Education Purpose only, not recomended for Buy and Sell,

ESAF Small Finance Bank LtdIts a "VERY RISKY PENNY STOCK".
May or May Not be a "Future Multibagger".
Fundamentals:-
Market Cap ₹ 2,608 Cr.
Book Value ₹ 48.4
Graham Number ₹ 89.5
Intrinsic Value ₹ 137
Industry PE 12
Stock PE 7.28
Dividend Yield 1.38 %
ROCE 8.91 %
ROE 20.2 %
Promoter holding 63.4 %
Pledged promoter 0 %
Debt ₹ 23,090 Cr.
Reserves ₹ 1,977 Cr.
Piotroski score 8
Technical:-
Price Breakout above 52 and retest on the "White Trendline".
Resistance are marked with Red horizontal lines.
Targets and Stoploss as marked on the Chart.
Levels are:-
Entry near 50
Breakout above 52
Stoploss 45
Tgt 63 - 68 - 71 - 82
This idea is for Educational purpose and paper trading only. Please consult your financial advisor before investing or making any position. Facts or Data given above may be slightly incorrect. We are not SEBI registered.

ESAF Small finance 50.73 - Buying Opportunity 30-40% returnsESAF is almost trading at 52 weeks low and company is paying Rs .70 dividend.
The company's balance is good and stock can give good returns in coming days.
There's good support at 49 levels and RSI is in Oversold zone. if the stock price is around 49 and rsi is above 30 then buy stocks and exit once your target reached.
Long term perspective stock could give up to 50% return

#ESAFSFBNSE:ESAFSFB
Newly listed small finance company.
High volumes seen, big hand entry.
SL: 67 DCB.

#ESAFSFB - IPO based breakout- 2X soon 🔥#ESAFSFB about to fly 🚀🔥
-CMP 78.6
-IPO based breakout(highly profitable)
- Inside Monthly CPR
-Volume Spurt
-Suppt 72.8

ESAFSFB bullish; above 76.5 ? - Wednesday 7th Feb.The above information does not constitute investment/trading recommendation and it is purely for educational purpose. Please check the Strategy below...
SWING Trading Strategy:
Position is created, only upon stock closing above the entry price on day closing basis and is held on for 5-10 trading sessions for larger gains (5-10%)
INTRADAY Trading Strategy:
1) Impulse upmove stage: The strong upmove (nearly upto 2% from breakoutprice) happens within five to 15 minutes. "High Risk Traders" buy in hope of another 2% upmove intraday.
"High Risk Traders" patiently wait through the Pullback-Consolidation stage to realize profits. High risk/High reward set up as breakouts may fakeout (reversal)also
2) Pullback-Consolidation stage: After the above "Impulse upmove stage"; the price may then pull back and move sideways (between "Open" price and "High" of the above "Impulse upmove stage").
Safe traders with minimum risk profile wait for a breakout from the consolidation to enter at this stage to relize high profits in the final intraday final "Breakout continuation" stage
3) Breakout continuation: Stocks often in the third stage breaks up above the "High" of the first "Impulse upmove stage" and continue to go higher again.
Both Safe Traders/High Risk Traders book profits at this stage
This do not constitute, financial, investment, trading, or other types of advice or recommendation.

ESAFSFB, ready to moveESAFSFB, ready to move
if the next candle opening is strong, i'll take entry
3DTC+Shakeout already done.

Next Multi-bagger could be possible, this is all set to fly highAs per my indicator signal, this stock shows Entry Signal in day chart. So expecting go up side. I have shared few Targets (Black Line) , and also shared SL (Brow Zone) . Hope my analysis will help.


Esaf sfb Target 80, 100, 125.
New listing
H1 eps 6, full year eps to be 12. Available at pe of 7. Extremely undervalued.
