[Buddha] ESCORTS Inside Bar TradeLong if it breaks the high of the previous day with a stop loss at the previous day's low.
Short if it breaks the low of the previous day with a stop loss at the previous day's high.
In case of gap up above the previous day's high or gap down below the previous day's low, please avoid buying it or selling it respectively. Follow the ending of the candle formed in first 5 minutes and follow ORB strategy.
ESCORTS trade ideas
ESCORTS LOOK OUT FOR THESE LEVELS!!! - UPDATEDALL THE LEVELS ARE MARKED ON CHART;
STOCK MIGHT FACE RESISTANCE NEAR 1220 PRICE FROM DAILY 20 EMA AND FIB LEVEL. SELL NEAR IT IF REVERSAL CANDLES ARE FORMED NEARBY IF FORMED NEARBY THE RED ZONE
BUY NEAR 1165-1175 LEVEL
The indicator used:
1) Daily Lines plots Daily 20 EMA on lower time frame charts
If you like the analysis, do leave a like and follow for more such content coming up.
The analysis is my POV, hope you got bucks in your pocket to consult a financial advisor before investing :P :)
HAPPY TRADING!!
ESCORTS LOOK OUT FOR THESE LEVELS!!! ALL THE LEVELS ARE MARKED ON CHART;
SELL NEAR THE RED ZONE IF REVERSAL CANDLES ARE FORMED ON THE ZONE/ NEAR BY THE ZONE
The indicator used:
1) Daily Lines plots Daily 20 EMA on lower time frame charts
If you like the analysis, do leave a like and follow for more such content coming up.
The analysis is my POV, hope you got bucks in your pocket to consult a financial advisor before investing :P :)
HAPPY TRADING!!
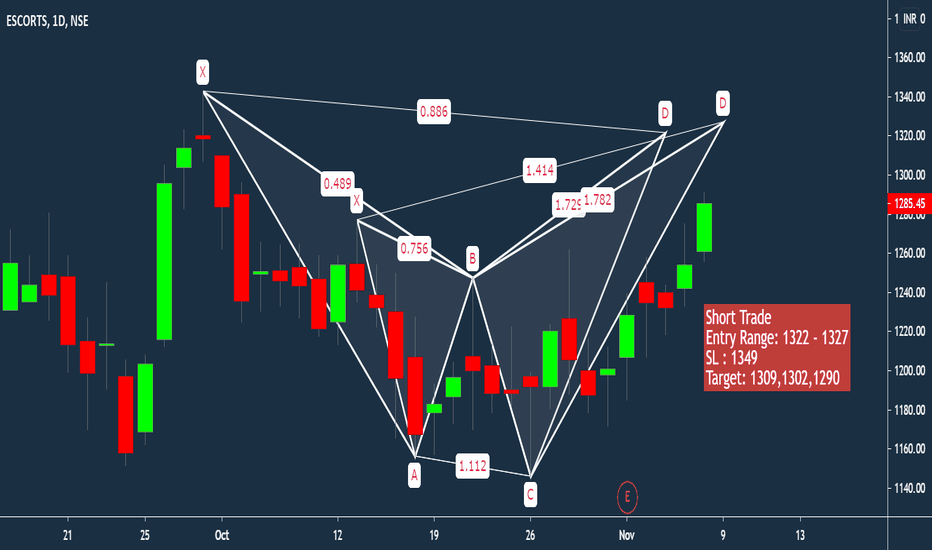
Escorts short (Weekly)I hope you can now see how Escorts represents an excellent low risk profit entry setup allowing you to trade in the market.Take positions so that the risk/reward is in your favor.
Knowing why, where & when a strong reversal signal is being generated will be the only way to capitalize on your technical analysis .
Thank You
Disclaimer: It should not be assumed that the methods, techniques, or indicators presented in these chart will be profitable or that they will not result in losses. There is no assurance that the strategies and methods presented will be successful for you. Past results are not necessarily indicative of future results. You should not trade with money that you cannot afford to lose. Examples presented in these products are for educational purposes only and it should not be assumed that these are indicative of ordinary trades. These setups are not solicitations of any order to buy or sell. The publisher assume no responsibility for your trading results. There is a high degree of risk in trading.


