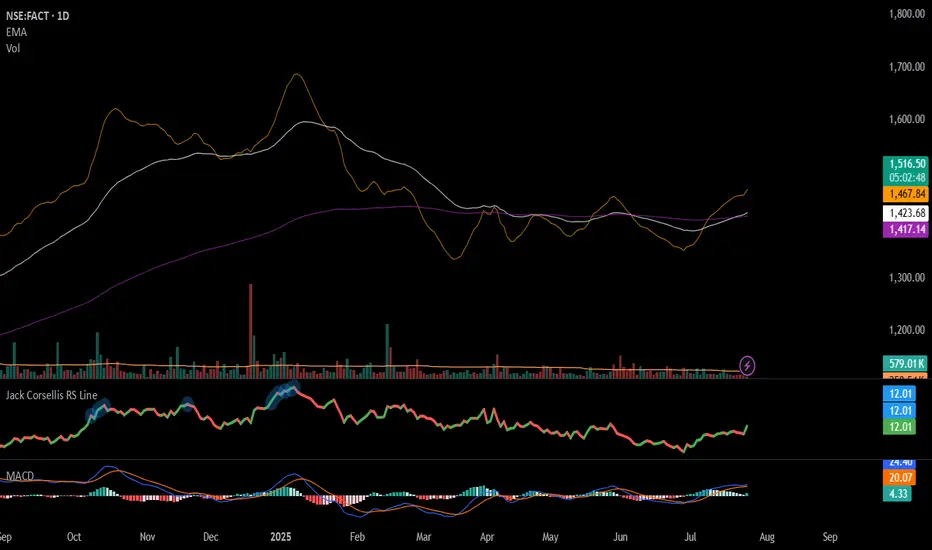
Price direction and Volatility (FACT)The concept of time cycles in the stock market suggests that market movements—both price direction and volatility—may follow predictable, recurring rhythms based on specific time intervals. The core idea is that history doesn't exactly repeat, but it often rhymes, and these rhythms can be measured i
Fertilizers & Chemicals Travancore Ltd.
No trades
1,896.30
0.45 INR
412.32 M INR
24.40 B INR
9.31 M
About Fertilizers & Chemicals Travancore Ltd.
Sector
Industry
Website
Headquarters
Kochi
Founded
1943
Identifiers
2
ISIN INE188A01015
Fertilizers & Chemicals Travancore Ltd. engages in the manufacturing and marketing of fertilizers and petrochemicals. It also focuses on engineering consultancy and design, and the fabrication and erection of industrial equipment. It operates through the Fertilizer and Petrochemical segments. The Fertilizer segment includes ammonium phosphate, NPK 15:15:15, and organic manure. The Petrochemical segment refers to caprolactam. The company was founded in 1943 and is headquartered in Kochi, India.
Related stocks

FACT LTD | Bullish Harmonic Pattern with Upside PotentialFACT LTD is showing a Bullish Harmonic Pattern (Gartley/Bat type) on the daily timeframe.
The pattern has completed near Point D (₹930–950 zone) and the price is attempting a reversal.
Bias: Bullish as long as price holds above ₹900.
Traders can watch for momentum confirmation before entry.

#IPCALAB - Rounding Bottom Breakout in DTF / Keep in WL📊 Script: IPCALAB
Key highlights: 💡⚡
📈 Rounding Bottom Breakout in Daily Time Frame
📈 Price consolidating near Resistance, then Breakout
📈 Volume spike during Breakout
📈 MACD Bounce
📈 Can go for a swing trade
BUY ONLY ABOVE 1535 DCB
⏱️ C.M.P 📑💰- 1518
🟢 Target 🎯🏆 – 12%
⚠️ Stoploss ☠️🚫 – 6%
⚠️ Im
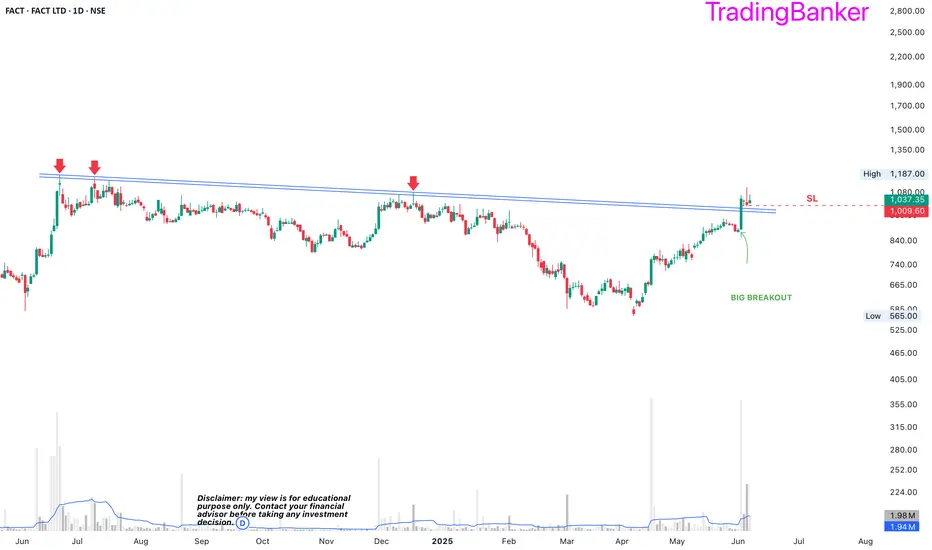
FACT: trendline breakout2. FACT
-strong breakout from the trendline resistance
- stop loss at 1009 giving a great reward to risk ratio
-volume uptick
-chemical sector has been moving recently and it may be a delayed move
FACT UPTRENDED Looking good strength 👍 with volume supply, it is not the recommendation of buying and selling , it is only for education purpose

FACT Trading Near Fresh Demand ZoneFACT is currently trading at ₹921.1, slightly above its fresh demand zone between ₹918.9 and ₹865.9, established on 29th November 2024. This untested zone suggests potential buying interest, and investors may monitor price movement closely for potential opportunities.
Disclaimer: This analysis is f

FACT - BullishThis stock has following attributes after testing the support at the Price Action line
1) Price > 50 DMA
2) 50 DMA > 200 DMA and diverging
3) Daily vol > Avg 30 D Vol
4) Supertrend 14,3 Buy zone
5) ADX > 25 and rising - Momentum increasing
6) Consistently making daily high higher then previous high

BUY TODAY SELL TOMORROW for 5%2 days ago
DON’T HAVE TIME TO MANAGE YOUR TRADES?
- Take BTST trades at 3:25 pm every day
- Try to exit by taking 4-7% profit of each trade
- SL can also be maintained as closing below the low of the breakout candle
Now, why do I prefer BTST over swing trades? The primary reason is that I have obs

10 Best Swing Trading ideas for December 2024 I daily make educational content videos for swing / positional trading

FACT - Breakout viewFACT :
Trendline breakout
Double bottom breakout
currently at resistance
Looks good above 1045 with support at 1000

See all ideas
Summarizing what the indicators are suggesting.
Oscillators
Neutral
SellBuy
Strong sellStrong buy
Strong sellSellNeutralBuyStrong buy
Oscillators
Neutral
SellBuy
Strong sellStrong buy
Strong sellSellNeutralBuyStrong buy
Summary
Neutral
SellBuy
Strong sellStrong buy
Strong sellSellNeutralBuyStrong buy
Summary
Neutral
SellBuy
Strong sellStrong buy
Strong sellSellNeutralBuyStrong buy
Summary
Neutral
SellBuy
Strong sellStrong buy
Strong sellSellNeutralBuyStrong buy
Moving Averages
Neutral
SellBuy
Strong sellStrong buy
Strong sellSellNeutralBuyStrong buy
Moving Averages
Neutral
SellBuy
Strong sellStrong buy
Strong sellSellNeutralBuyStrong buy
Displays a symbol's price movements over previous years to identify recurring trends.
MIDCAPETF
Mirae Asset Nifty Midcap 150 ETF Exchange Traded Fund UnitsWeight
0.15%
Market value
224.21 K
USD
MID150CASE
Zerodha Nifty Midcap 150 ETF Exchange Traded Fund UnitsWeight
0.15%
Market value
27.79 K
USD
ELM250
Edelweiss Nifty LargeMidcap 250 ETF Units Exchange Traded FundWeight
0.07%
Market value
7.80 K
USD
MULTICAP
Mirae Asset Nifty500 Multicap 502525 ETF Exchange Traded Fund UnitsWeight
0.04%
Market value
2.53 K
USD
MIDQ50ADD
DSP Nifty Midcap 150 Quality 50 ETF Units Exchange Traded FundWeight
0.15%
Market value
1.31 K
USD
Explore more ETFs
Frequently Asked Questions
The current price of FACT is 808.65 INR — it has decreased by −1.55% in the past 24 hours. Watch Fertilizers & Chemicals Travancore Ltd. stock price performance more closely on the chart.
Depending on the exchange, the stock ticker may vary. For instance, on NSE exchange Fertilizers & Chemicals Travancore Ltd. stocks are traded under the ticker FACT.
FACT stock has risen by 0.84% compared to the previous week, the month change is a −10.36% fall, over the last year Fertilizers & Chemicals Travancore Ltd. has showed a −7.47% decrease.
FACT reached its all-time high on Jun 21, 2024 with the price of 1,187.00 INR, and its all-time low was 3.50 INR and was reached on Nov 23, 2001. View more price dynamics on FACT chart.
See other stocks reaching their highest and lowest prices.
See other stocks reaching their highest and lowest prices.
FACT stock is 2.66% volatile and has beta coefficient of 2.36. Track Fertilizers & Chemicals Travancore Ltd. stock price on the chart and check out the list of the most volatile stocks — is Fertilizers & Chemicals Travancore Ltd. there?
Today Fertilizers & Chemicals Travancore Ltd. has the market capitalization of 529.66 B, it has decreased by −0.01% over the last week.
Yes, you can track Fertilizers & Chemicals Travancore Ltd. financials in yearly and quarterly reports right on TradingView.
FACT net income for the last quarter is −679.00 M INR, while the quarter before that showed 208.60 M INR of net income which accounts for −425.50% change. Track more Fertilizers & Chemicals Travancore Ltd. financial stats to get the full picture.
Yes, FACT dividends are paid annually. The last dividend per share was 0.39 INR. As of today, Dividend Yield (TTM)% is 0.05%. Tracking Fertilizers & Chemicals Travancore Ltd. dividends might help you take more informed decisions.
Fertilizers & Chemicals Travancore Ltd. dividend yield was 0.06% in 2024, and payout ratio reached 61.21%. The year before the numbers were 0.15% and 48.93% correspondingly. See high-dividend stocks and find more opportunities for your portfolio.
As of Jan 30, 2026, the company has 2.19 K employees. See our rating of the largest employees — is Fertilizers & Chemicals Travancore Ltd. on this list?
EBITDA measures a company's operating performance, its growth signifies an improvement in the efficiency of a company. Fertilizers & Chemicals Travancore Ltd. EBITDA is 1.05 B INR, and current EBITDA margin is −61.69%. See more stats in Fertilizers & Chemicals Travancore Ltd. financial statements.
Like other stocks, FACT shares are traded on stock exchanges, e.g. Nasdaq, Nyse, Euronext, and the easiest way to buy them is through an online stock broker. To do this, you need to open an account and follow a broker's procedures, then start trading. You can trade Fertilizers & Chemicals Travancore Ltd. stock right from TradingView charts — choose your broker and connect to your account.
Investing in stocks requires a comprehensive research: you should carefully study all the available data, e.g. company's financials, related news, and its technical analysis. So Fertilizers & Chemicals Travancore Ltd. technincal analysis shows the sell today, and its 1 week rating is sell. Since market conditions are prone to changes, it's worth looking a bit further into the future — according to the 1 month rating Fertilizers & Chemicals Travancore Ltd. stock shows the neutral signal. See more of Fertilizers & Chemicals Travancore Ltd. technicals for a more comprehensive analysis.
If you're still not sure, try looking for inspiration in our curated watchlists.
If you're still not sure, try looking for inspiration in our curated watchlists.