Finolex Industries: A Potential Long-Term InvestmentFinolex Industries has recently formed a butterfly pattern in its stock chart and is currently positioned within a strong support zone around ₹200. The stock has experienced a significant decline of approximately 40%, making it potentially attractive for long-term investors.
Fundamental Analysis of Finolex Industries
Performance Overview: In the fiscal year 2024, Finolex Industries reported a 2.3% increase in revenue and an impressive 89% increase in net income compared to the previous year. The net profit margin also improved to 11% during this period.
Price-to-Earnings (P/E) Ratio: The current P/E ratio stands at 16.6, indicating reasonable valuation relative to earnings.
Debt Levels: The company maintains a low debt-to-equity ratio of 0.068, reflecting strong financial stability and minimal reliance on debt financing.
Return on Equity (ROE): Finolex achieved a solid ROE of 13.69%, showcasing efficient use of equity capital to generate profits.
Net Profit Margin: The net profit margin reached 18.98%, indicating effective cost management and profitability.
Market Capitalization: As of the latest data, Finolex Industries has a market cap of approximately ₹135 billion, which positions it well within the industry.
Yearly Performance Highlights
In the last fiscal year, the company demonstrated resilience with an increase in total income by 8.3% year-over-year in Q4 FY24, despite facing challenges such as raw material price fluctuations.
The company's earnings per share (EPS) saw a significant rise, increasing by nearly 89.6% year-over-year, reflecting robust growth in profitability.
FINPIPE trade ideas

#FINPIPE.. stock shaping well for a move upStock made a good formation at the base SL hunts back in April , followed by a strong move up and retracement . Recent moves showing signs of trend continuation . Keep on radar
Finolex Industries LtdDate 19.04.2025
Finolex Industries
Timeframe : Weekly Chart
Finolex Industries Limited (FIL) is a leading manufacturer of PVC Resin and the largest producer of PVC Pipes & Fittings in India.
Technical Remarks :
1 Broke 4 years long support channel emerged since covid 2020 lows
2 Below 200 weekly exponential moving average + 50% of Fibonacci retracement
3 Open= low past week candle is critical swing low as stoploss for fresh entries + 61.8%
4 Rsi went below 30 & bounce hence keep 30 rsi also as stoploss if breaks past week low
Fundamental remarks :
1 Stock P/E = 22.8
2 ROCE = 10.9 % & ROE = 8.14 %
3 OPM = 12% approx
Pros
Company has reduced debt.
Company is almost debt free.
Company has been maintaining a healthy dividend payout of 31.1%
Cons
The company has delivered a poor sales growth of 6.91% over past five years.
Company has a low return on equity of 10.7% over last 3 years.
Earnings include an other income of Rs.677 Cr.
Debtor days have increased from 29.9 to 38.7 days.
Promoter = 52.47%
DII = 11.70%
FII = 6.48%
Government = 0.01%
Public = 28.99%
Others = 0.35%
Regards,
Ankur

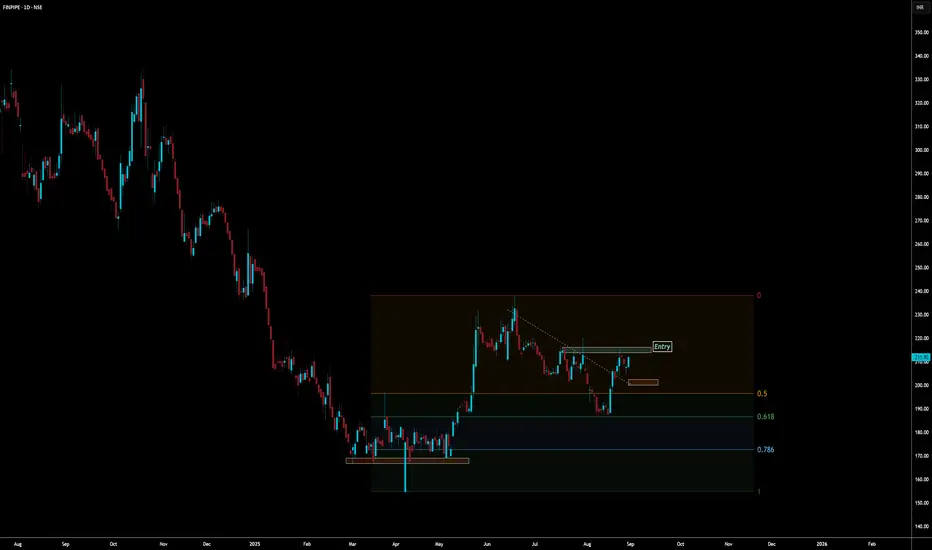
Finolex Industries LTD view based on harmonic patternsMy view on Finolex Industries LTD, as you can see there is nice gartely pattern has been formed , alongwith that it has got support at 0.78% fib level.
Based on FIB level , target is marked and SL is also placed.
So, lets look how it turns.
Thank you.
#finolexindustries #harmonicpatterns #finolex #harmonictrader

Reversal @ FINPIPE
STOCK: Finolex Industries Ltd.
SETUP: The price was facing the same resistance since 2021 ie 245 to 260, and finally gave a break out on March 24, and tested the 350 level, price again at the same break out restest level, and Bullish RSI divergence is visible can reverse from the same level to test again 350
VOLUME: High volume visible
PLAN: Entry: above 260, STOP: 235 TARGET: 1:2
NOTE: For learning purposes, only # Manage your risk
NOTE: Will not update on the same setup, Take target or Stop

Finolex Pipes - Falling Wedge Finolex Pipe has created Falling Wedge pattern, it has minimal volumes in this fall from 340 level.
Breakout zone is above 250 level.
Buy @ 240 level
SL 225
Target of the pattern is 340-350 level.
Time Frame : Short Term.

FINPIPE Trading Within Fresh Demand ZoneFINPIPE is currently trading at ₹255.7, positioned within its demand zone between ₹257.7 and ₹251.3, identified on 24th April 2024. This fresh zone remains untested, suggesting potential buying interest if the stock price consolidates within this range. Investors may watch for signs of support, which could present a buying opportunity with a potential upward move.
Disclaimer: This analysis is for informational purposes only and should not be considered as financial advice. Please conduct your own research or consult a financial advisor before making any investment or trading decisions.

Finolex could not sustain the breakout, whats next?Failed breakout means buyers trapped.
It tried to bounce back but failed again.
The stock may soon touch 245 levels.
Observations from the Chart:
* Downward Trend: The overall trend of the stock appears to be downward, as indicated by the descending channel formation.
* Failed Breakout: The stock attempted to break above the resistance level but failed, leading to a bearish candle. This suggests a lack of buying pressure and a potential continuation of the downtrend.
* EMA Crossovers: The 10-day EMA has crossed below the 20-day EMA, which is another bearish signal. This indicates that short-term momentum is weaker than the long-term trend.
Potential Scenarios:
* Continuation of Downtrend: If the selling pressure persists, the stock may continue its downward movement and test the lower boundary of the channel or even the 245 level as mentioned.
* Consolidation: There's a possibility that the stock may consolidate within the channel for some time before making a decisive move. This consolidation phase could be characterized by sideways price action or small fluctuations within the channel.
* Potential Reversal: While unlikely given the current technical indicators, a reversal could occur if strong buying pressure emerges and the stock breaks above the resistance level. However, this scenario is less probable at the moment.
Recommendations:
Given the current technical outlook, it's advisable to adopt a cautious approach towards this stock. Consider the following:
* Avoid Buying: It's not recommended to initiate new long positions in this stock at the moment.
* Existing Positions: If you already hold a long position, consider tightening your stop-loss to protect your capital.
* Short-Term Traders: Short-term traders could consider short-selling opportunities if the stock breaks below the lower channel boundary or the 245 level. However, this should be done with proper risk management.
Disclaimer:
This analysis is based on the provided chart and technical indicators. It's important to conduct thorough research and consider additional factors before making any investment decisions. Technical analysis is not foolproof, and market conditions can change rapidly. Always consult with a financial advisor to get personalized advice.

FINOLEX INDUSTRIES by KRS Charts18th October 2024 / 11:45 AM
Why FINPIPE ❓
1. All over Uptrend Stock since listed.
2. Recent bottom with Cup & Handle Pattern Breakout and Retest with Strong Green Candles with Strong Volume 👍
3. 283 Rs nearest Good Support
4. Better Entry zone marked as we can see in the Chart.
Target - 400 + Rs
SL - 260 Rs Closing Basis

Finolex Industries Ltd ( FINPIPE)- AnalysisBullish Levels -day closing above above 307 (early entry) then 340 (safe entry if day closing above this) the 404 to 411
Bearish levels :- Day closing below 288 Swing trade SL then 250 (SL for Long term Investor) below this more bearish.
**Consider some Points buffer in above levels
**Disclaimer -
I am not a SEBI registered analyst or advisor. I does not represent or endorse the accuracy or reliability of any information, conversation, or content. Stock trading is inherently risky and the users agree to assume complete and full responsibility for the outcomes of all trading decisions that they make, including but not limited to loss of capital. None of these communications should be construed as an offer to buy or sell securities, nor advice to do so. The users understands and acknowledges that there is a very high risk involved in trading securities. By using this information, the user agrees that use of this information is entirely at their own risk.
Thank you

Medium term trading opportunity in Finolex Ind for v. good upsidHi,
NSE:FINPIPE has given a Bullish Flag Breakout on Weekly charts with very good volume.
MACD is also on the bullish side on Weekly time frames. RSI is also on the bullish side on daily, weekly and monthly time frames.
In the current market scenario, I am expecting that the bullish momentum will continue.
Complete price projection like entry, stop loss and targets mentioned on the charts for educational purpose.
Don't Forget to Follow me to get all the updates.
Please share your feedback or any queries on the study.
Disclaimer: Please consult your financial advisor before making any investment decision.

Break-OutReady for the next up move with good fundamental can be taken with a SL of 305 and target would be 340-350

Breaking Out From Falling Wedge Pattern- Looking Bullish ✅The stock has broken out of a falling wedge pattern, which is a bullish reversal structure. The breakout signals that the consolidation phase has ended, and the stock is now ready to resume its upward movement. A falling wedge pattern typically indicates a strong potential upside once the breakout is confirmed.
✅ There has been a significant increase in volume as the price broke out of the wedge, confirming strong buying interest. The spike in volume suggests that institutional investors may be entering the stock, adding to the momentum behind the breakout.
✅ The price has been forming higher lows, a bullish signal indicating that demand is increasing at each dip. This continuous accumulation at lower levels further strengthens the case for a strong rally ahead.
✅ The RSI is currently at 72 entering the overbought zone. While this indicates strong bullish momentum, traders should be cautious of a potential pullback. However, if the RSI remains elevated for an extended period, it often signals a sustained rally, particularly after a breakout from a strong pattern like the falling wedge.
✅Based on the height of the wedge, the next immediate target is 350, followed by 365, which aligns with previous resistance levels. If the stock manages to maintain its momentum and volume, it could move toward these levels in the short term.
✅A retest of the 300-305 zone may occur before further upward movement, providing an opportunity for additional entries. However, if the price remains above 310 without a retest, it indicates sustained bullish strength and could accelerate the move towards 350+.

Stock near Support Zone: Finolex IndustriesFinolex Industries has been in a downtrend for a long time.
The stock is trading around the key support of 281 levels.
Support levels: 275, 262, 253
20 EMA (Black line) is below 50 EMA (Orange trend), indicating that the bearish trend may continue.
Once the price reaches the support levels, we expect some consolidation.
If a breakout with good volume is confirmed, you can enter for long-term targets.
Resistance levels: 291, 312, 33, 351


FINOLEX INDUSTRIES ON BUYING LEVELStock is obeying the trendline from the past few months as shown on the chart.
stock is taking support on 200 moving average.
Can hold it for at least a month or 2 for the desired target.
DO NOT TRADE IF BREAKS THE TREND LINE
DISCLAIMER - Analyse yourself before investing.
HAPPY TRADING

FINPIPE- future stock be cautious to enterThe Finpipe results have been released, and they are quite impressive. However, it's common for promoters to attempt to shake out weak hands following strong results. This pattern appears to be repeating with FINPIPE. It would be wiser to enter above 347 or at 251.

#FINPIPE #NSE - TRENDLINE SUPPORTFINOLEX INDUSTRIES
Trading at trendline support.
Close within 52 week zone.
Outperformer.
Disclaimer:
For educational purpose only.
Please do your own research before taking any trades.
Happy Trading!

Cup and Handle Pattern in Finolex Industries on Weekly ChartFinolex Industries has making good chart pattern on Weekly time frame.
Buy (Half qty) at 235
Buy (Full qty) at 250
SL at 200
Target 1: 280
Target 2: 305
Target 3: 350


FINPIPE bullish; above 326 ? - Monday 3-June.The above information does not constitute investment/trading recommendation and it is purely for educational purpose....
INTRADAY Trading Strategy in 3 stages of breakouts:
1) Impulse upmove stage: The strong upmove (nearly upto 1.5% from trigger-price) happens within five minutes. "High Risk Traders" buy on breakouts in hope of continuation of upmove. "High Risk Traders" may have to patiently wait through the Pullback-Consolidation stage to realize profits. High risk:High reward set up as breakouts may fakeout (reversal)also
2) Pullback-Consolidation stage: After the above "Impulse upmove stage"; the price may then pull back and move sideways (between "Open" price and "High" of the above "Impulse upmove stage"). "Safe traders" with minimum risk profile wait for a breakout from the consolidation stage to enter into trade , to book high profits in the final "Breakout continuation" stage
3) Breakout continuation: Stocks often in the third stage breaks up above the "High" of the first "Impulse upmove stage" and continue to go higher again.
Both Safe Traders/High Risk Traders book profits at this stage
SWING Trading Strategy:
Position is created, only upon stock closing above the entry price on day closing basis and is held on for 5-10 trading sessions for larger gains (5-10%)
The above information do not constitute, financial, investment, trading, or other types of advice or recommendation.It is purely for educational purpose....

Finolex pipes cup and handle patternFinpipes has formed cup and handle.
Stock has bounced from important demand zone and consolidating near trendline.
Levels mentioned on chart.
Good risk reward according to the levels.
Idea shared for educational purposes

FINPIPE - 8 Months Consolidation / All Time High BreakoutFinolex Industries Ltd
1) Time Frame - Daily.
2) The Stock has been in a Consolidation since (September, 2023). Now It has given a Consolidation breakout & Closed above it's Previous Life Time High with good bullish momentum candle & with huge volume in daily Time Frame.
3) The stock may find It's next resistance around the (price 300) in short term.
5) Recommendation - Strong Buy
