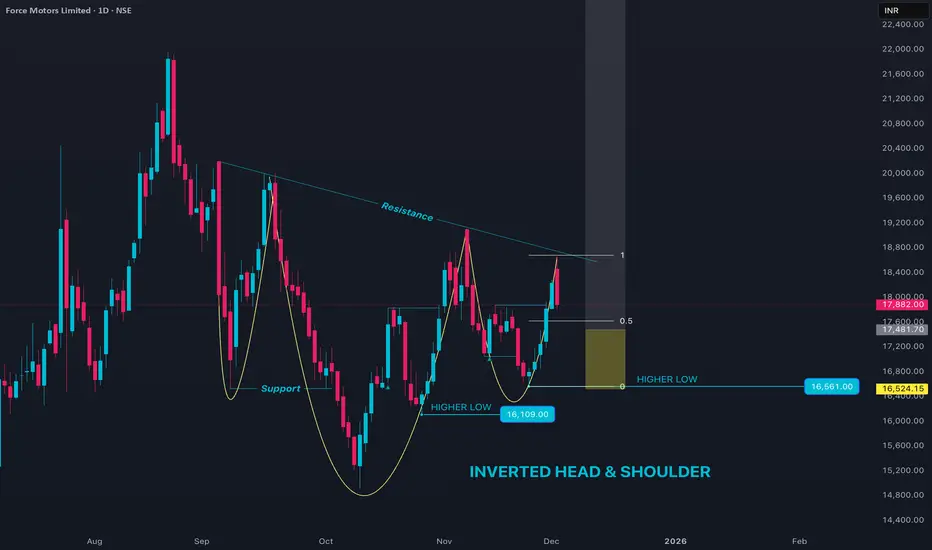
FORCEMOT Reentry set up1. Trend Bullish
2. High low protected
3. Set up: Inverted H&S
4. Price retracing from resistance
5. RR: 10+RR
Trade ideas
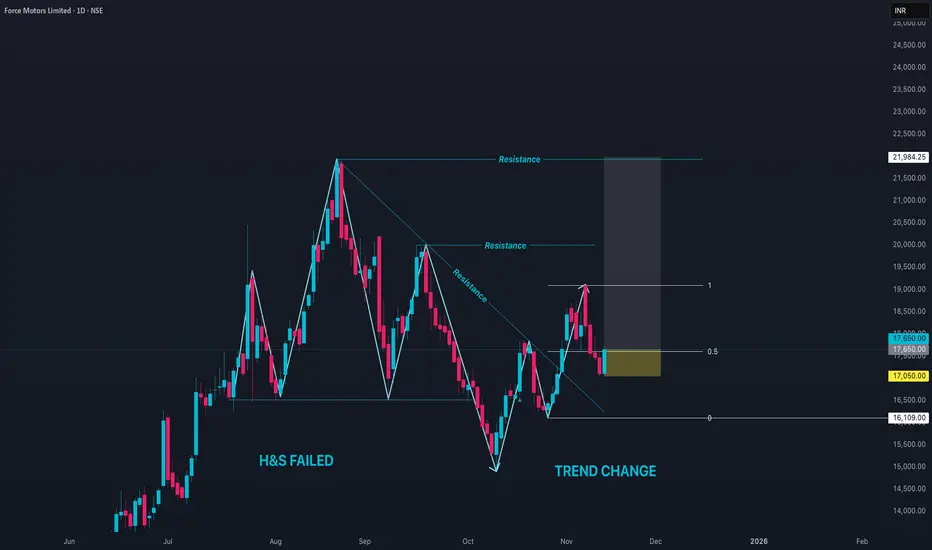
FORCEMOT Reversal set upProbable reasons for long
1. Trend change with higher low
2. H&S failed as market trend is bullish
3. Price trading in discount zone
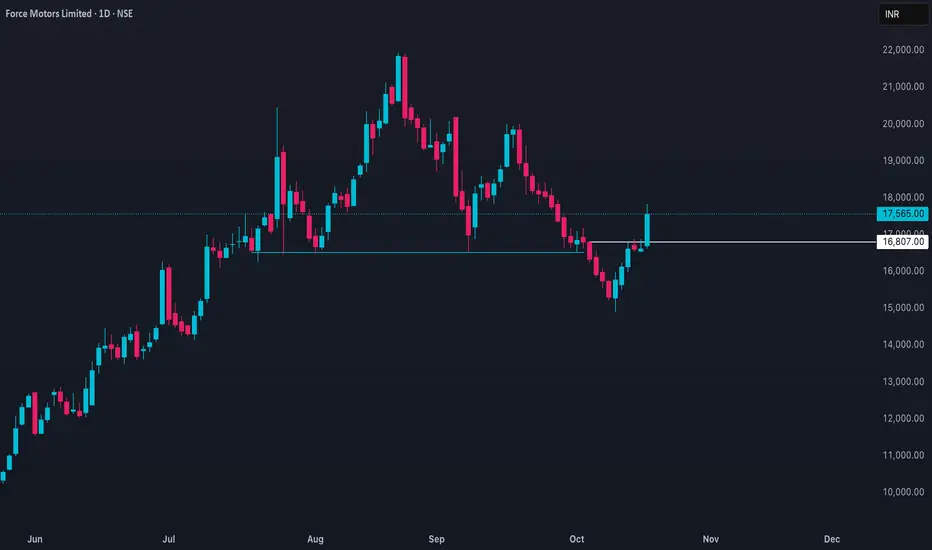
FORCEMOT Price Action PyramiddingForce Motors Ltd closed at ₹17,565 on October 17, 2025, gaining about 5.67% over the previous day amid strong volume and broad sector momentum. The stock traded between a high of ₹17,830 and a low of ₹16,624 during the session. This rise extends a rebound from mid-October levels after multiple sessions of consolidation near ₹16,000.
The near-term structure appears bullish, with momentum indicators showing strength; RSI has climbed above the neutral 50 mark, reflecting renewed buyer interest. The next resistance levels are positioned around ₹17,950–₹18,200, while immediate support lies at ₹17,000 followed by ₹16,500. Sustained closes above ₹18,200 could lead to further upside toward ₹18,800–₹19,000.
Fundamentally, Force Motors maintains a market capitalization of about ₹23,100 crore with a trailing P/E around 26.7 and P/B near 7.0, implying continued valuation expansion supported by strong earnings growth. The broader uptrend from late August lows remains intact, and short-term dips toward support zones may attract buying interest if overall market sentiment stays favorable.
Correction will be a buying opportunityForce Motors CMP 18086
Elliott - the stock has completed its 3rd wave. A three wave correction ABC will start. This correction will target 14300 zone. It will also have time correction. Hence this stock should not be looked at before Dec 25.
Once the correction is done the 5th wave will begin that will tgt 27400. The tgt will be double from the 14300 zone. And best part it will come in quick time. so if u get the stock at 14300 do not miss it.

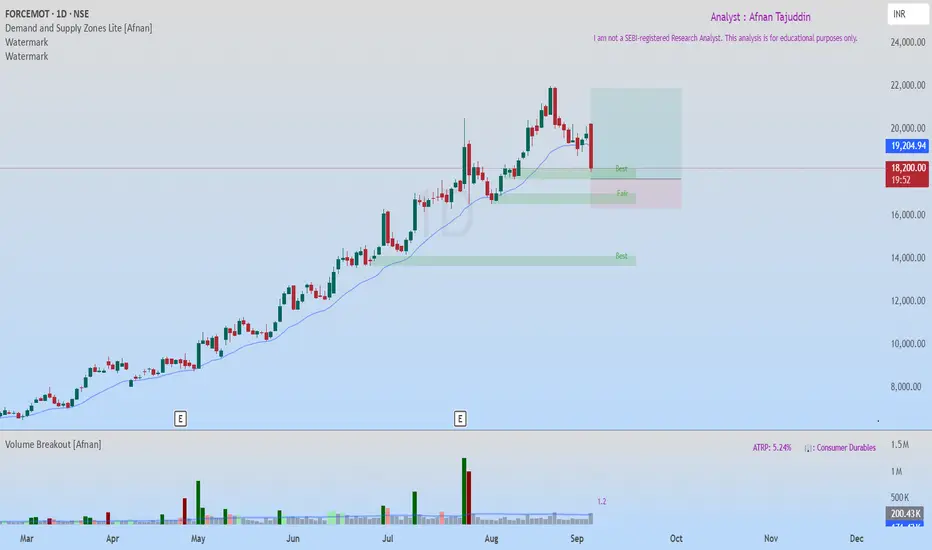
FORCEMOT – Demand Zone Footprint of Smart Money📈 Daily Chart Outlook 📈
Price action on FORCEMOT is showing a clear and strong uptrend , recently pulling back from its all-time high . Such healthy corrections are often where the real opportunities lie, especially when aligned with powerful demand zones.
At present, price is in a Rally-Base-Rally (RBR) demand zone . This structure is not just a random area on the chart – it represents a fresh footprint of smart money , where large institutional players previously stepped in.
🔥 Level-on-Level 🔥
A very interesting observation here is the presence of a Level-on-Level (LoL) formation – two demand zones stacked closely together. This layering effect provides a cushion of demand:
If the first zone absorbs selling pressure, buyers may already push price upward.
If it dips deeper, the second zone offers another safety net of demand.
🎯 Risk-Reward Perspective 🎯
Traders can plan entries with tighter and more refined risk management. With the trend intact and demand zones waiting below, the setup looks promising. The Risk-to-Reward ratio (RR) is around 1:3 , which is highly attractive for swing traders aiming for well-structured trades.
📌 Key Highlights 📌
Strong uptrend from the all-time high.
Price approaching fresh RBR demand zone – a smart money footprint.
Risk-to-Reward ≈ 1:3 – favorable for disciplined traders.
"In trading, patience is not just a skill, it’s your biggest edge."
⚡ Keep learning, keep growing, and let the charts guide you! ⚡+
💡 Final Note 💡
This analysis is shared purely for educational purposes . I am not a SEBI registered analyst, and this should not be considered as a trading or investment recommendation.
Lastly, Thank you for your support, your likes & comments. Feel free to ask if you have questions.
Force motor bullish Structure - Higher Lows Force motor is very good company in auto sector . It's in uptrend, high Momentum Stocks. It's Showing Strength after every Retracement. You can see this after retracement.

BUY TODAY SELL TOMORROW for 5%DON’T HAVE TIME TO MANAGE YOUR TRADES?
- Take BTST trades at 3:25 pm every day
- Try to exit by taking 4-7% profit of each trade
- SL can also be maintained as closing below the low of the breakout candle
Now, why do I prefer BTST over swing trades? The primary reason is that I have observed that 90% of the stocks give most of the movement in just 1-2 days and the rest of the time they either consolidate or fall
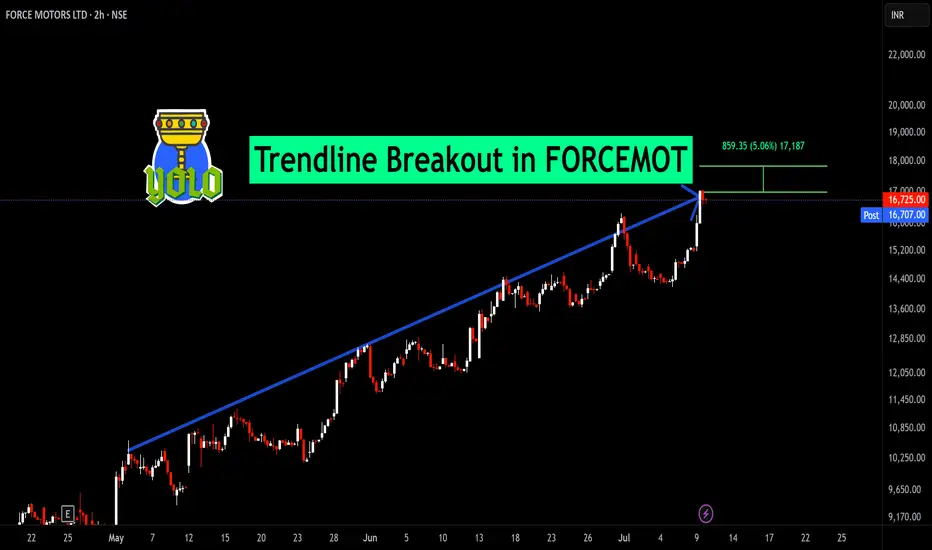
Trendline Breakout in FORCEMOT
BUY TODAY SELL TOMORROW for 5%
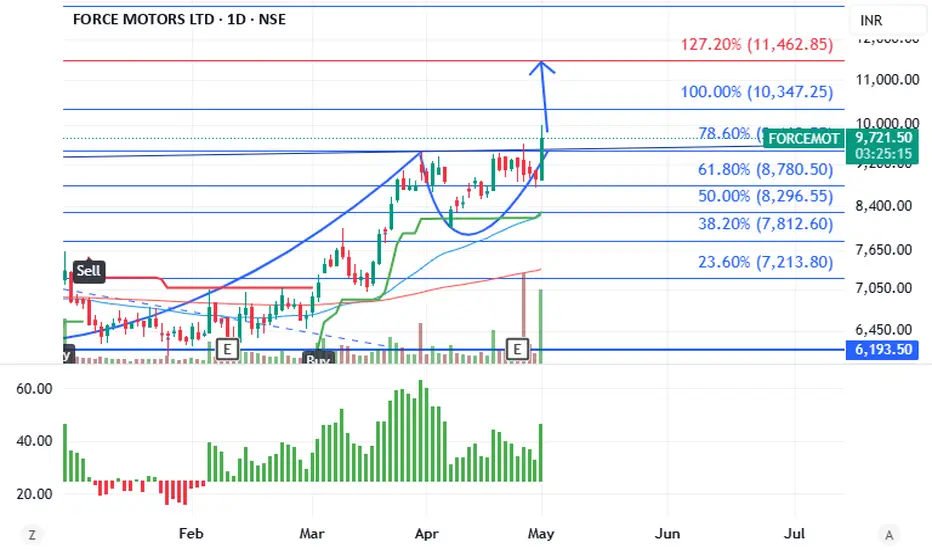
FORCE MOTORS Ltd. - BullishThis stock price is waiting for a Breakout and has almost completed the Cup and handle formation.
1) ADX>25
2) Supertrend > 50 DMA > 200 DMA hence the bullish trend already established
Target 11462 and onwards based on Fibonacci marked on the chart.
this study is for academic purpose and no recommendation to invest.
FORCE MOTOR 1 DAY CHART Force motor 1 Day Chart Shows Good Strength with Demands Zones at Bottom, Gst cut by Govt Fuled Auto sector it's moved good . It's a good buy on Retracement. Like and Share . Thanks . No buy sell Reccomendation. It's for educational purposes only.
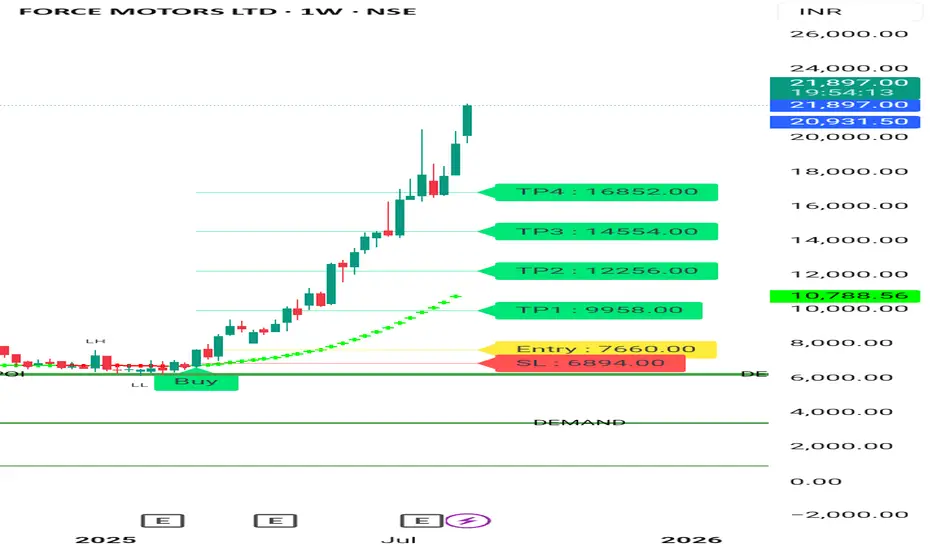
FORCEMOT#InvestmentPick | #Positional
Buy @ cmp 1455 & in dips till 1200 | MCBSL 918 | Tgt 1700 / 2200 / 2500.
As long as holds above 918 MCB, stock can move towards 3000 / 3700 / 4200+ in Long-Term

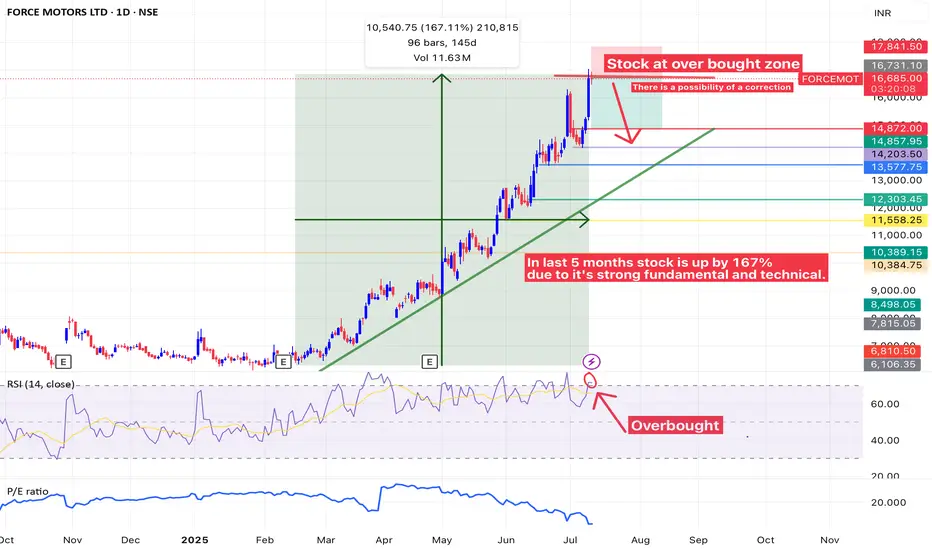
Technical analysis of Force Motors Ltd (NSE: FORCEMOT) 🔍 Technical Analysis Summary
📈 Trend and Price Action
• The stock has shown strong bullish momentum, gaining 167.11% in the last 145 days (about 5 months).
• Price action is respecting a steep upward trendline, indicating persistent buying interest and a strong uptrend.
• Current Price: ₹16,731 (as shown)
• Significant resistance zone: Around ₹16,700–₹17,000 (price appears to be stalling here).
⸻
⚠️ Overbought Signal
• The RSI (Relative Strength Index, 14-period) is in the overbought zone (>70), currently indicating:
• Overextension of the rally.
• Possible short-term correction or consolidation phase ahead.
• The RSI also shows a bearish crossover, where the RSI line crosses below the signal line, which can signal weakening momentum.
⸻
🔻 Correction Possibility
• As noted on the chart: “There is a possibility of a correction.”
• The first potential support levels in case of a pullback:
• ₹14,872
• ₹14,857.95
• ₹14,203.50
• ₹13,577.75 (near the trendline support)
• Strong base zone: ₹12,303.45 – ₹12,000
These levels could serve as buy-on-dip zones for long-term investors if fundamentals remain intact.
⸻
📊 Volume and PE Ratio
• Volume seems steady but not spiking dramatically—indicating healthy participation, not euphoria.
• P/E Ratio line at the bottom appears to be falling slightly, which could mean:
• Earnings have improved or stock price growth is now slightly outpacing earnings.
⸻
📌 Key Observations
• ✅ Uptrend remains intact: No major breakdown of structure yet.
• ⚠️ Overbought condition: RSI and steep price rise warn of potential short-term correction.
• 🔄 Healthy retracement expected: As part of a bullish continuation pattern or to retest support zones.
• 📉 Bearish divergence potential: If RSI forms a lower high while price makes a higher high (not clearly visible yet).
⸻
📈 Final Verdict:
Short-term: Caution is advised. Wait for confirmation of a pullback or consolidation before entering new positions.
Medium to Long-term: Still bullish due to strong price action and fundamentals, but consider partial profit-booking or trailing stop losses.
⸻
Would you like a deeper analysis using Fibonacci retracement or want a target estimation after correction?
FORCEMOT Price action **Force Motors (FORCEMOT) Price Analysis – April 21, 2025**
**Current Price:** ₹9,229
**Trend:** Strong uptrend, up 40% in the past three months.
**Support:** ₹8,700–₹8,900
**Resistance:** ₹9,270 (previously ₹10,272, the 52-week high).
**Outlook:** Bullish above ₹9,000. A breakout above ₹9,270 could potentially retest the 52-week high.
**Summary:** The momentum is strong, and the trend remains positive unless the price falls below ₹8,700.

BUY TODAY SELL TOMORROW for 5%DON’T HAVE TIME TO MANAGE YOUR TRADES?
- Take BTST trades at 3:25 pm every day
- Try to exit by taking 4-7% profit of each trade
- SL can also be maintained as closing below the low of the breakout candle
Now, why do I prefer BTST over swing trades? The primary reason is that I have observed that 90% of the stocks give most of the movement in just 1-2 days and the rest of the time they either consolidate or fall
Round Bottom Breakout in FORCEMOT
BUY TODAY SELL TOMORROW for 5%
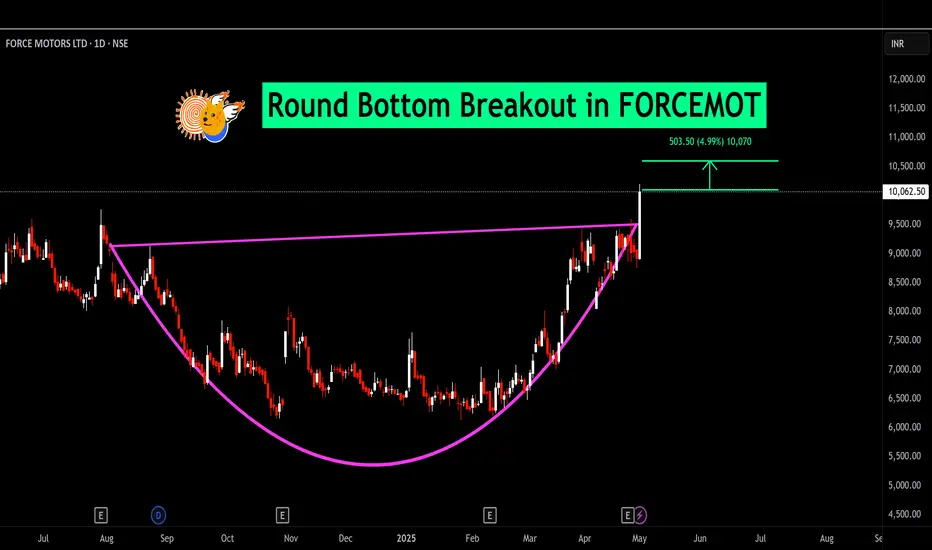
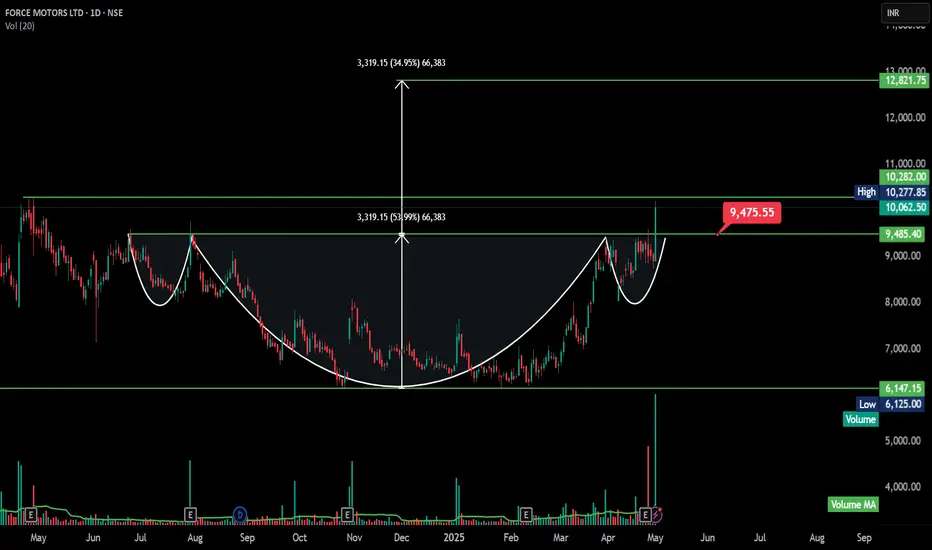
FORCEMOT - Inverted Head and Shoulder - BreakoutThe chart technical analysis of Force Motors Ltd (NSE)**, showing a **cup and handle breakout pattern**—a bullish continuation formation. Here's a breakdown of the key insights:
---
# Pattern: Inverted Head and Shoulders (Bullish Reversal)
Left Shoulder: Formed around July–August 2023.
Head: Formed in December 2023, with a deeper low.
Right Shoulder: Formed in April 2025, with a higher low.
Neckline: Drawn across the resistance zone around ₹9,475.55 — now broken.
💥 Breakout Confirmation
Price has broken above the neckline at ₹9,475.55, closing at ₹10,062.50 with a strong 12.88% gain and high volume, confirming the bullish breakout.
📊 Measured Move Target
Height (Head to Neckline) ≈ ₹3,319.15
Breakout Target = ₹9,475.55 + ₹3,319.15 = ₹12,821.75
→ This matches the projection shown on the chart (~35% upside from breakout)
🔍 Volume Analysis
Breakout is accompanied by a large volume spike (~810K vs avg), which is critical for validating an inverted head & shoulders breakout.
📏 Key Technical Levels
Breakout Point / Neckline: ₹9,475.55 (Now Support)
Resistance: ₹10,277.85 (intraday high on breakout day)
Target: ₹12,821.75
Stop-loss: Below ₹9,475 (e.g., ₹9,200–9,300 zone), depending on risk tolerance
🧭 Strategic Takeaway
This breakout from an inverted H&S pattern suggests a bullish trend reversal after a prolonged downtrend, and the volume confirmation adds strength to the setup.
Price Movement for Force MotorsExpect the price to move towards the closest demand zone @ 8780 form where the demand will be pushed upwards to break its current high of 9601. We can then expect the price to move in an upwards direction and move up till its lifetime high.
I am not SEBI registered. The information provided here is for learning purposes only and should not be interpreted as financial advice. Consider the broader market context and consult with a qualified financial advisor before making investment decisions.

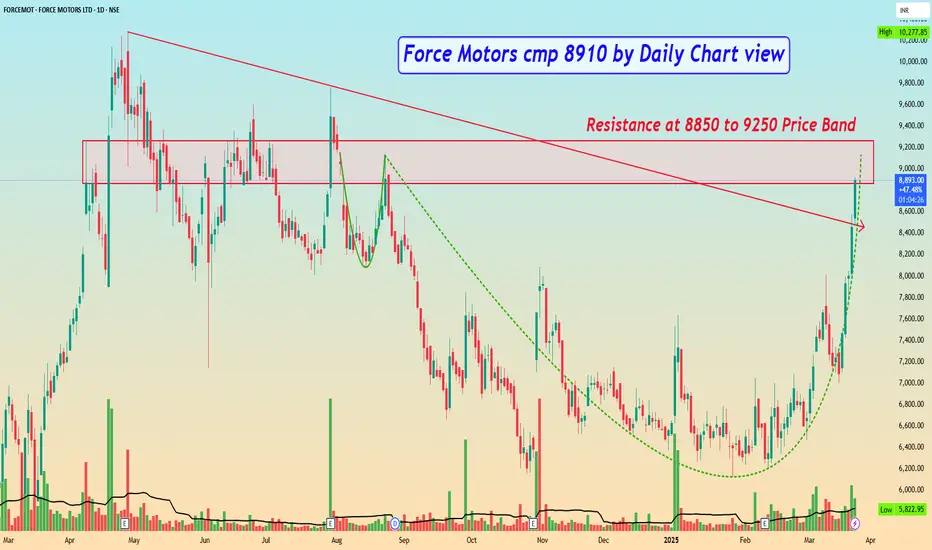
Force Motors cmp 8910 by Daily Chart viewForce Motors cmp 8910 by Daily Chart view
- Resistance at 8850 to 9250 Price Band
- Support Zone seen at 8050 to 8350 Price Band
- Bullish Rounding Bottom in process at Resistance Zone neckline
The FORCE that Drives INDIA = FORCE MOTORSTHE FORCE
Force Motors was established in 1958 by Shri. N. K. Firodia, with the vision to provide affordable commercial transport for the masses by harnessing the best available technology and offering economical, reliable and efficient products. Today, its range includes Small Commercial Vehicles (SCV), Multi-Utility Vehicles (MUV), Light Commercial Vehicles (LCV), Special Vehicles (Off-roaders / Recreation Vehicles and Military Vehicles). So no matter what the need be, Force has a solution to offer.
From avg range of 2k to 10k & currently quoting at 7275
Its a good LONG TERM STOCK
For Trade Details - Pls view the Chart
FULLY VERTICALLY INTEGRATED
Force motors is fully vertically integrated, making its own engines, chassis, gear boxes, axles, bodies etc. For the entire product range.
Force provides appropriate solutions for transport – both goods, as well as passenger - rugged, reliable and efficient transport solutions for every need - rural or urban, long distance or local, over good city roads or rough rural roots.
The company continues in the founder's vision of providing efficient, utilitarian vehicles that empower the individual entrepreneur to meet his and the country's ever changing needs.
INTERNATIONAL ASSOCIATIONS
Over the last five decades Force Motors has partnered with leading global automotive names like Daimler, BMW, Rolls-Royce, ZF, Bosch, MAN etc. Through these associations it has developed necessary expertise in-house to harness the latest advances in technology and developing relevant mobility solutions.
if you like this idea 💡 --- Plz don't miss to Boost 🚀
For more info - Plz visit my profile & Follow me
Rgds,
Naresh G
SEBI Reg.RA

Force Motors Date 11.02.2025
Force Motors
Time Frame : Day Chart
Force Motors Q3FY25Earnings Highlights 📊
🏭 Total Income: ₹1,90,438 Lakh 🟢 (+12.3% YoY, -2.3% QoQ)
💼 PBT: ₹17,715 Lakh 🟢 (+29.6% YoY, -16.2% QoQ)
💰 PAT: ₹11,534 Lakh 🟢 (+35.0% YoY, -14.6% QoQ)
💵 EPS: ₹87.52 🟢 (+35.0% YoY, -14.6% QoQ)
*Don't average below neckline, wait for price to cross above 200 EMA, Ichimoku cloud & Descending resistance
Regards,
Ankur

Small SL Big Target on Force motors around 6440-6480 levelsA long trade can be initiated in FORCE MOTORS around 6440-6480 levels for target of 6880++ 6970++ 7120++ 7500++ levels with sl around 6350-6380 levels All for URBANIA sales number and quality of ride,

Force Motors: A Technical and Fundamental Play in Demand ZoneWelcome traders! Today, we're diving deep into Force Motors, a stock currently sitting in a significant demand zone. Let’s break down the technical and fundamental aspects that make this stock an interesting opportunity.
Monthly and Weekly Demand Zones:
When we look at the monthly chart , Force Motors is currently trading in a strong Rally Base Rally (RBR) demand zone . This zone is a crucial area where price often finds support and can lead to a bounce back.
If we zoom into the weekly chart , we notice that the price has already reacted from a weekly RBR demand zone nested inside the monthly zone. Last week’s candle formation is notable because it’s an absorption candle , indicating that the selling pressure has been taken over by buyers.
📊 Volume Analysis:
The presence of large green volume bars compared to smaller red bars further suggests that the selling is minimal, showing a clear sign of strength.
The price is currently in a healthy pullback from its all-time high, which often provides a great buying opportunity for savvy traders.
🧠 Fundamental Strength: A Company on the Rise 💪
Force Motors is not just looking good technically; its fundamentals are also rock solid. The company's Piotroski F-score is 9, indicating strong financial health. This score assesses several financial criteria, including profitability, leverage, and operating efficiency, confirming that the company is fundamentally sound.
Recent quarterly (June 2024) numbers are impressive:
Net Sales: Rs 1,884.90 crore in June 2024, up 26.71% from June 2023.
Net Profit: Rs. 115.70 crore in June 2024, up 68.76% from June 2023.
EBITDA: Rs. 264.13 crore, up 37.52% from June 2023.
EPS: Increased to Rs. 87.81 from Rs. 52.04 in June 2023.
These numbers reflect not just growth but also consistent performance. Such fundamentals often provide a safety net for technical setups, adding an extra layer of confidence.
🔍 Institutional Interest: The Big Players Are Watching 👀
We always like to see where institutional money is flowing because it often moves the market. For Force Motors, the institutional investment data is promising:
FII/FPI holdings have increased from 6.34% to 7.78% in the June 2024 quarter.
Number of FII/FPI investors rose from 124 to 160.
Institutional Investors’ holdings jumped from 7.20% to 8.80%.
This surge in institutional interest tells us that the big players are finding value in Force Motors at these levels. Their buying can lead to further price appreciation as they tend to have a long-term view.
The current price is trading in area where institutions have increased their stakes most probably, indicating that these monthly and weekly demand zones are genuine footprints of smart money. This means we are aligning our trades with institutional players. The likelihood of the price falling from this area is quite low because institutions typically protect their positions. These demand zones suggest that there may be pending or unfilled buy orders from smart money, so entering a trade here means we are trading alongside these big players.
💡 Trade Setup: A Clear Plan for Traders 🗺️
Based on the technical and fundamental analysis, here’s a potential trade setup:
Entry: You can consider buying at the current price level, which is within the strong demand zone.
Stop Loss: Place your SL below the demand zone or, if you don't want to take big risk, just keep SL below last week’s candle low with a buffer.
Target: Aim for at least a 1:2 risk-reward ratio. You can ride the rally by trailing your stop-loss, ensuring you lock in gains as the stock moves in your favor
⚠️ A Word of Caution: Always Manage Your Risk
Trading is about probabilities, not certainties. Even the best setups can fail, so always manage your risk. This analysis is for educational purposes only. I'm not a SEBI registered analyst, and you should do your own research before making any trading decisions.
🔥 Keep Trading and Keep Growing! 📈💪
"Success in trading is not about being right, but about managing your risk and emotions." 💡
Thank you for your support, likes, and comments. Feel free to ask any questions! Your interaction keeps me motivated to share more valuable insights.
Happy trading, and may the markets be ever in your favor! 🎯🚀

Force Motors - Flag Pattern in Making Flag Pattern breakout @ 8500++
Pole Height : 8000 points
Target : 10000-12000-14000-17000
SL 5800
Time Frame : Long Term (18 months ++ )

Force Motors Date 15.08.2024
Force motors
Timeframe : Day chart
Remarks :
1 Formation of descending triangle & support of 100 ema extended to the neckline of descending triangle.
2 However, the price action is below the cloud & until price crossed upwards to cloud for breakout will be weak bullish.
3 If at all breaks down 100 ema + neckline, then don't try to catch falling knife
4 Moment within the triangle pattern is sideways journey.
Regards,
Ankur

Forcemotors - flag & Pole BO - Best Above 9700#ForceMotors Posted Excellent Results
Solid Q1FY25
Rev at 1884cr vs 1487cr
PBT at 186cr vs 110cr, Q4 at 210cr
PAT at 115cr vs 68cr, Q4 at 140cr
One can enter above 9700 with Stop loss of 8027.
The stock can see target of 10,000, 13000 , 15K, 18K and 20K
Disclaimer : Please treat this as a Eductional content.
