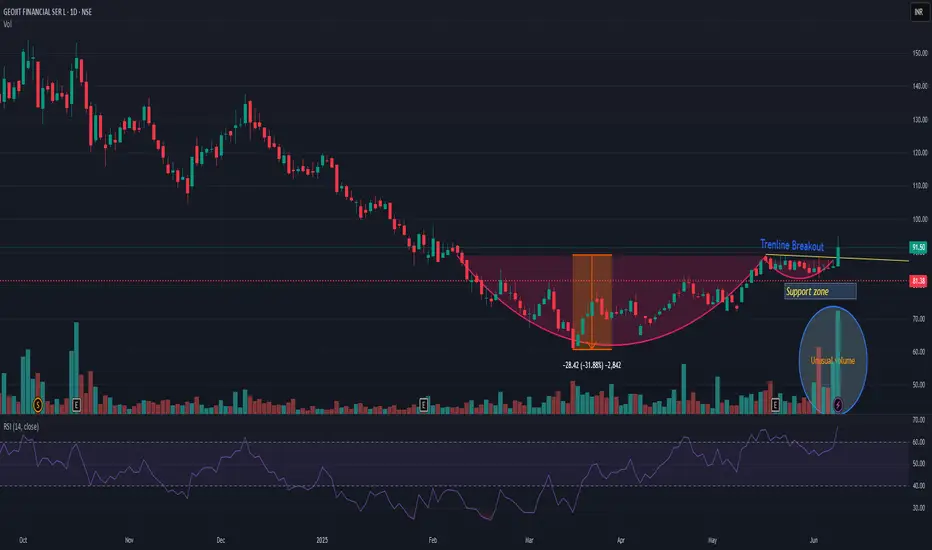
Geojit Financial ServicesForming a cup & handle at bottom which indicates a big move incoming.
Also, Volumes sprut can be seen which adds to breakout probablity.
1st target - 107
SL - (-4%)
A good setup with High Risk to reward ratio.
GEOJITFSL trade ideas

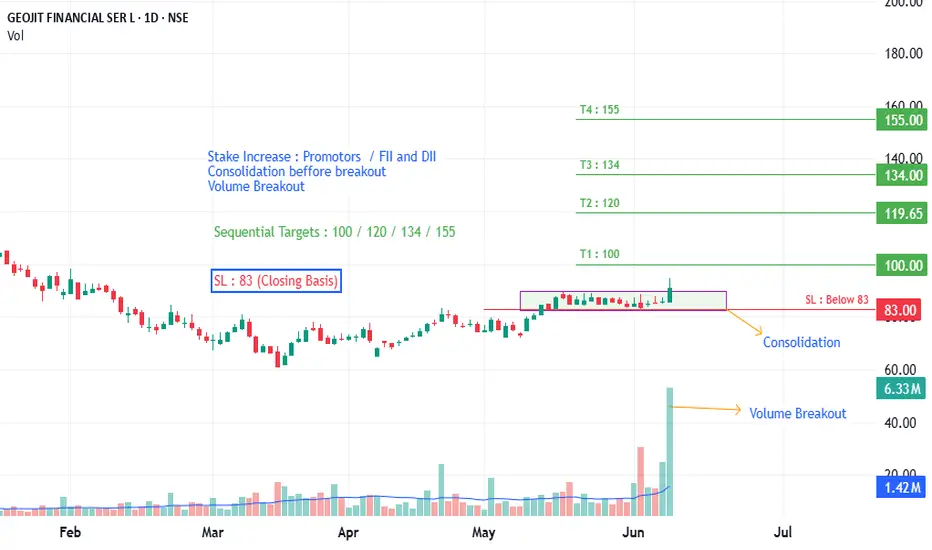
GEOJIT FINANCIALS Stake Increase : Promotors / FII and DII
Consolidation beffore breakout
Volume Breakout
Sequential Targets : 100 / 120 / 134 / 155
SL : 83 (Closing Basis)
GEOJITFSLGEOJITFSL showing strength and has given short term breakout. Cup and handle pattern has also been observed. Now if I see pattern target then 25-30% up side is possible. Since September highest volume also observed today. My view will be changed if it closes below 81. Risk reward is quite in favor.
Geojit Financial Services Pole & Flag pattern Geojit making a clear “Pole & Flag” pattern on daily chart. Started moving today in target’s direction. Target comes at around 40%.

Stock Opportunity: Geojit Finance LtdHey everyone! 🌟
Geojit Finance Ltd. has recently given a multiyear breakout and is now in a phase of range contraction. What's interesting is that volume is dropping, which is typically a healthy sign of consolidation.
On top of that, the fundamentals look strong and the company is expected to deliver a good quarter ahead, which could further fuel its momentum.
Here's what we’re watching for:
📉 Volume contraction – Signaling reduced selling pressure.
📊 Potential breakout – Keep an eye out for the next move to position ourselves!
💹 Strong fundamentals – Supporting long-term growth potential.
I'll be monitoring closely, and it might be a good time to do the same if you're interested. 🚀
#StockMarket #GeojitFinance #BreakoutStocks #InvestmentOpportunity #StockAlert #Fundamentals

Geojit Financial Services - Breakout Setup, Move is ON...#GEOJITFSL trading above Resistance of 147
Next Resistance is at 228
Support is at 96
Here are previous charts:
Chart is self explanatory. Levels of breakout, possible up-moves (where stock may find resistances) and support (close below which, setup will be invalidated) are clearly defined.
Disclaimer: This is for demonstration and educational purpose only. This is not buying or selling recommendations. I am not SEBI registered. Please consult your financial advisor before taking any trade.

Multiyear BreakoutMultiyear Breakout, Geojitfsl has broken strong multiyear resistance with strong candle and Great volume and RSI is good

Geojit Financial Services Long TradeThis stock had been in downtrend since 2017 making lower highs. It had given a breakout of the downward sloping trend line this year. The breakout level was retested with follow up move on the upside breaking out of the recent swing high confirming the trend change to the upside. The stock this week breaks the All time high level with good volumes as well as RSI moving above 70 levels confirming the momentum. The stock can be a good long trade at current levels and can be bought on dips till 145 level being the area of retesting the breakout level. 120 level can be a good place to keep a Stop Loss.

16 year Breakout: GEOJIT FINANCIALSGEOJIT has broken the multi-year breakout levels of 132 on the monthly chart.
Volume is Increasing confirming the Uptrend.


Risky reversal trade for 2x returns!Geojit financial has shown cup and handle breakout from trendline.
We have seen similar chart in Heromotorcorp where ATH levels have been breached.
We might get to see a similar story in this stock.
Do check out my Hero motor corp analysis as well.
If you like my analysis, please like it and follow me for more such trading ideas.

Bullish Breakout: Geojit Financial Services Sustaining Above 140Details:
Asset: Geojit Financial Services Limited (GEOJITFIN)
Breakout Level: Sustaining above 140
Potential Target: 180+
Stop Loss: Below 140 or as per risk tolerance
Timeframe: Short to medium-term
Rationale: Geojit Financial Services Limited (GEOJITFIN) has given a bullish breakout and is now sustaining above the 140 level. This breakout could lead to further upward momentum, with the potential to reach or exceed the 180 mark.
Market Analysis:
Technical Breakout: The sustained move above 140 following the breakout indicates a strong bullish trend, with the potential to attract further buying interest.
Market Sentiment: Positive sentiment around GEOJITFIN, possibly driven by favorable market conditions or strong financial performance, may support this upward move.
Price Target:
The target for GEOJITFIN is set at 180+, based on the breakout and sustained upward momentum.
Risk Management:
Implementing a stop loss strategy below 140 is crucial to manage risk in case of any unexpected price reversals.
Timeframe:
The move towards 180+ is anticipated in the short to medium-term, but actual timing may vary based on market dynamics.
Risk-Reward Ratio: Consider individual risk tolerance and adjust position size accordingly to maintain a favorable risk-reward ratio.
As with any investment opportunity, conduct thorough analysis and consider factors such as market trends, company fundamentals, and risk management strategies before making trading decisions.

Geojit Financial Services Ltd. (NSE: GEOJITFSL) - 20th Aug 2024Key Support Levels:
3-Year High Support: The stock has taken support above its 3-year high, which is around ₹102.70. This level has proven to be crucial for the stock, acting as a strong support zone.
200-Day EMA Support: The 200-day EMA is currently positioned at approximately ₹88.11, offering a robust long-term support level. This moving average has historically acted as a floor for the stock price, preventing further decline.
Resistance Levels:
Immediate Resistance: The immediate resistance is near the ₹115 level, where the stock has faced selling pressure in the past. A break above this level could lead to a retest of higher resistance zones.
Major Resistance - All-Time High: The major resistance is the all-time high at ₹147.05. A breakout above this level could signal the continuation of the long-term bullish trend.
Market Outlook:
The chart suggests that the stock has found strong support above its 3-year high, which could act as a launching pad for the next upward move. The 200-day EMA at ₹88.11 provides additional support, making this level critical for long-term investors.
Potential Upward Move:
The chart indicates a potential upward trajectory, with the possibility of retesting and breaking the ₹147.05 all-time high. If the stock maintains its support above ₹102.70 and gains momentum, the next target could be around ₹130-₹135 in the short to medium term.
Downside Risk:
On the downside, if the stock fails to hold the support at ₹102.70, it could test the 200-day EMA around ₹88.11. A break below this level would be a bearish signal, potentially leading to a more extended downtrend.
Trading Strategy:
For Bulls: Consider entering on a breakout above ₹115, with a target near ₹130-₹135 and a stop-loss below ₹102.70.
For Bears: Consider shorting if the stock breaks below ₹102.70, with a target near the 200-day EMA at ₹88.11, keeping a stop-loss above ₹115.


GEOJITFSL - EXCELLENT SETUP FOR LONG TERM INVESTORSThe pattern is based om Monthly TimeFrame so it is meant only for long term Investors
Made a high on Jan 08 of 131 and then went under a major contraction of 10 Years when it again made a high of 147 in Oct 17. That was the formation of first contraction.
Similarly it went for another contraction of 4 yrs & then eventually of 3 years.
It can give a big upside if it is able to break 147 and pass 150 levels
Another possibility is it can go for another contraction but what makes the present contraction more promising is the spurt in Volume which might take the price action cross the major barrier
So its a case of Wait and Watch

GEOJITFSL - Long Term Pick with 40-50% upside & 15-20% riskGEOJITFSL has given breakout of 6yrs long resistance level at 100.
This has good upside potential with possible targets at 135, 147, 150+
If this closes above 102 on weekly basis, it can be bought for long term period.
Risk in the trade is 15% as closing below 90 will invalidate the pattern.
Thanks
Piyush Gupta
Learn & Earn

Geojit Financials 97.8 >>>41.90Geojit Financial Services Limited offers a complete spectrum of financial services including online broking, financial products distribution, portfolio management services, margin funding, etc.

Resistance Breakout 52W HighPlease look into the chart for a detailed understanding.
Caution at 96.1 level
Consider these for short-term & swing trades with 2% profit.
For BTST trades consider booking
target for 1%-2%
For long-term trades look out for resistance drawn above closing.
Please consider these ideas for educational purpose
Please note that, if there are some big targets, those are drawn thinking for long term.

Geojit fin- long on monthly charts, bullish IB formation followed by an bullish engulfing pattern
MACD crossover indicate bullish momentum
similar trends on weekly and daily charts
can double from this level
Target and SL marked

GEOJITFSLGeojit financial has broken monthly resistance with high volume. 70 is a Best support to buy. This rally can move up side. First Target is 97.

Geojit another stock ready for making highsvolume is low as of now let institutions enter then enter in breakout if volume is good , i am expecting another 20% after breakout

Rounding bottom pattern!Rounding bottom pattern is formed in the stock. Wait for breakout above 70. SL @ 67

GEOJITFSL : Breakout Stock#GEOJITFSL #breakout #swingtrade #momentumtrade
GEOJITFSL : Swing trade
> Breakout with huge Volume
> Momentum stock
> Good Strength in stock
> Overall Positive structure in D/W charts
Swing Traders can lock 10% profit & keep trailing
Please Like or comment if u r Liking the analysis & Learning from it. Keep showing ur Love
Disclaimer : This is not a Trade Recommendations & Charts/ stocks Mentioned are for Learning/Educational Purpose. Do your Own Analysis before Taking positions.
