HARUN STOCKS – NIFTY VIEW (10/11/2025 – 12:00 NOON IST)HARUN STOCKS – NIFTY VIEW (10/11/2025 – 12:00 NOON IST)
Hello friends,
Here is my latest observation on the Nifty Spot Index based on Elliott Wave Theory, which I have been practicing in the Indian markets since 2001.
Currently, Nifty Spot is trading around 25,645. On the weekly chart, Nifty appe
Next report date
—
Report period
—
EPS estimate
—
Revenue estimate
—
47.95 INR
6.99 B INR
55.90 B INR
79.35 M
About Gland Pharma Ltd.
Sector
Industry
CEO
Giri Shyamakant
Website
Headquarters
Sangareddy
Founded
1978
ISIN
INE068V01023
FIGI
BBG00Y2K95K5
Gland Pharma Ltd. manufactures pharmaceutical ingredients and injectable formulations. It offers injectables including vials, ampoules, pre-filled syringes, lyophilized vials, dry powders, infusions, and ophthalmic solutions. The company was founded by P. V. N. Raju in 1978 and is headquartered in Sangareddy, India.
Related stocks

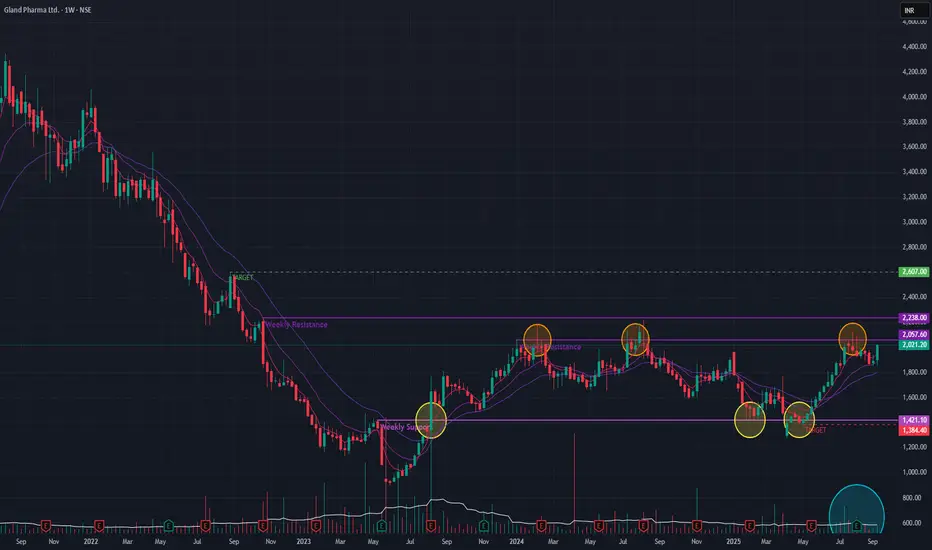
Gland Pharma (Weekly Timeframe) - Breakout of Sideways trend ?After a prolonged downtrend from its all-time high in August 2021, Gland Pharma has been trading in a sideways consolidation range since August 2023. Recent price action suggests that the stock is building momentum for a potential breakout, signaling a possible end to its bearish phase.
## Bullish
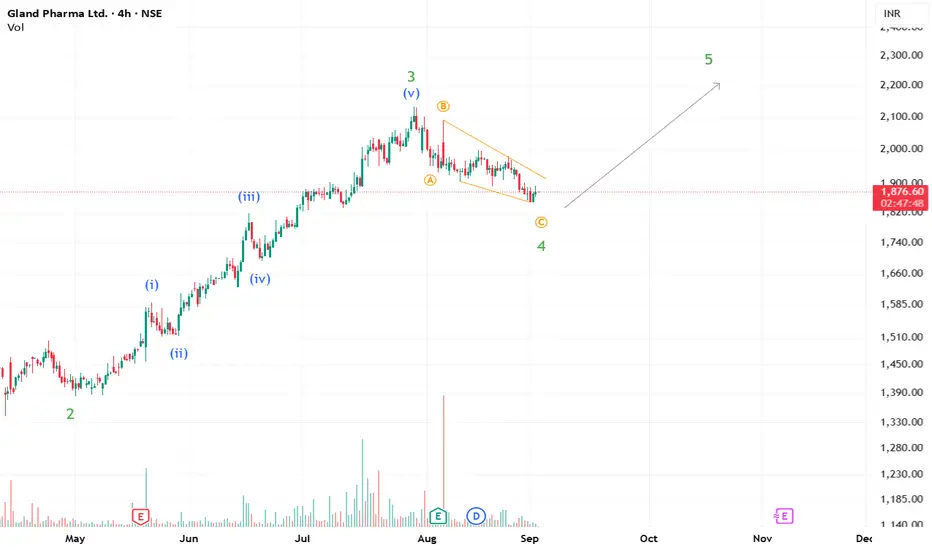
Bullish view for Gland Pharma?!!As probable Wave 4 approaches its end, we may see an upside to complete Wave 5 in Gland Pharma.
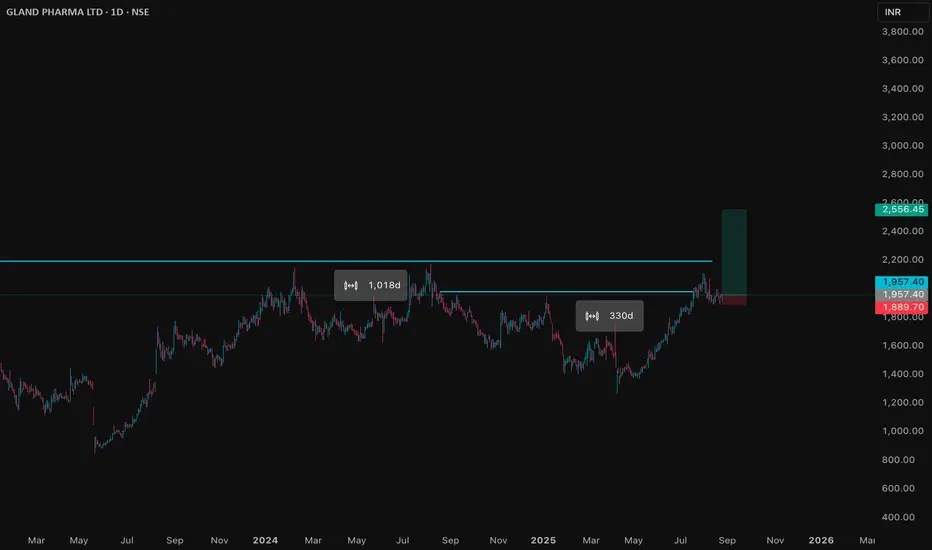
GLAND Price ActionGland Pharma’s stock has witnessed strong buying interest in August 2025, climbing notably after its Q1FY26 results showed a 50% jump in profits and improved margins. The company’s stock has rebounded after a period of earnings decline, supported by new product launches and operational efficiency ga
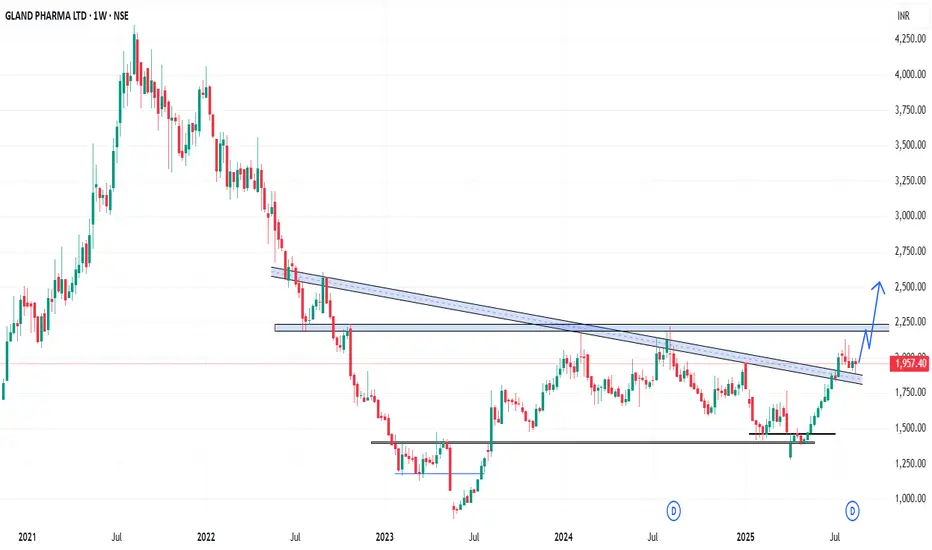
GLAND - Weekly AnalysisIn the Weekly Chart of GLAND ,
we can see that, it has created a Hammer candle on support..
Expected momentum is shown in chart.
SWING OBSERVATION - GLAND PHARMA Script is in good intraday momentum after bouncing from major support around 1400 levels, breaking Box pattern showing HH HL. Target can be swings resistance around 1700

GLAND - opportunity for quick 3% gainsNSE:GLAND
cmp 1520
there is an opportunity for getting quick 3% gains in this stock.
on hourly timeframe there is trendline breakout plus positive diversion on the RSI
I will be looking for entry at cmp 1515 with target of 1565
SL will be 1443.
The objective of this analysis is knowledge sharing

NSE GLAND: A Critical Resistance Zone That Could Shift the TrendTimeframe: Daily
In NSE GLAND, the price has respected the channel in three distinct moves, indicating a potential 3-wave correction setup. Currently, it is trading below the 50 and 100 EMA, with ATR at 55.96 and ADX at 42.07 .
After reaching a high of 2220 , the price declined and formed a cor

Bottomed-out GlandHighest OPM% in Dec Quarter and stocks CMP is less than its Intrinsic value. Right time to accumulate more for long position upto 60% price growth ahead.

Gland Pharma Ltd. Ready for A Big Move?➡️ Price Analysis & Overview:
1. Volume Strength: Current volumes are decent, but a spike in buying activity could confirm momentum.
2. Technical Structure: It is near the 0.38 Fibonacci level and could go up from there.
My Trade Plan:
1. I expect the bullish momentum to continue, with a potential

See all ideas
Summarizing what the indicators are suggesting.
Neutral
SellBuy
Strong sellStrong buy
Strong sellSellNeutralBuyStrong buy
Neutral
SellBuy
Strong sellStrong buy
Strong sellSellNeutralBuyStrong buy
Neutral
SellBuy
Strong sellStrong buy
Strong sellSellNeutralBuyStrong buy
An aggregate view of professional's ratings.
Neutral
SellBuy
Strong sellStrong buy
Strong sellSellNeutralBuyStrong buy
Neutral
SellBuy
Strong sellStrong buy
Strong sellSellNeutralBuyStrong buy
Neutral
SellBuy
Strong sellStrong buy
Strong sellSellNeutralBuyStrong buy
Displays a symbol's price movements over previous years to identify recurring trends.
PHARMABEES
Nippon India Nifty Pharma ETF Units Exchange Traded FundWeight
1.91%
Market value
2.20 M
USD
Explore more ETFs
Frequently Asked Questions
The current price of GLAND is 1,837.90 INR — it has increased by 1.12% in the past 24 hours. Watch Gland Pharma Ltd. stock price performance more closely on the chart.
Depending on the exchange, the stock ticker may vary. For instance, on NSE exchange Gland Pharma Ltd. stocks are traded under the ticker GLAND.
GLAND stock has fallen by −5.46% compared to the previous week, the month change is a −2.71% fall, over the last year Gland Pharma Ltd. has showed a 0.89% increase.
We've gathered analysts' opinions on Gland Pharma Ltd. future price: according to them, GLAND price has a max estimate of 2,360.00 INR and a min estimate of 1,680.00 INR. Watch GLAND chart and read a more detailed Gland Pharma Ltd. stock forecast: see what analysts think of Gland Pharma Ltd. and suggest that you do with its stocks.
GLAND reached its all-time high on Aug 12, 2021 with the price of 4,350.00 INR, and its all-time low was 861.00 INR and was reached on May 22, 2023. View more price dynamics on GLAND chart.
See other stocks reaching their highest and lowest prices.
See other stocks reaching their highest and lowest prices.
GLAND stock is 3.28% volatile and has beta coefficient of 0.68. Track Gland Pharma Ltd. stock price on the chart and check out the list of the most volatile stocks — is Gland Pharma Ltd. there?
Today Gland Pharma Ltd. has the market capitalization of 304.68 B, it has decreased by −2.59% over the last week.
Yes, you can track Gland Pharma Ltd. financials in yearly and quarterly reports right on TradingView.
Gland Pharma Ltd. is going to release the next earnings report on Jan 28, 2026. Keep track of upcoming events with our Earnings Calendar.
GLAND earnings for the last quarter are 11.20 INR per share, whereas the estimation was 13.67 INR resulting in a −18.08% surprise. The estimated earnings for the next quarter are 16.02 INR per share. See more details about Gland Pharma Ltd. earnings.
Gland Pharma Ltd. revenue for the last quarter amounts to 14.87 B INR, despite the estimated figure of 15.37 B INR. In the next quarter, revenue is expected to reach 16.31 B INR.
GLAND net income for the last quarter is 1.84 B INR, while the quarter before that showed 2.15 B INR of net income which accounts for −14.76% change. Track more Gland Pharma Ltd. financial stats to get the full picture.
Yes, GLAND dividends are paid annually. The last dividend per share was 18.00 INR. As of today, Dividend Yield (TTM)% is 0.97%. Tracking Gland Pharma Ltd. dividends might help you take more informed decisions.
Gland Pharma Ltd. dividend yield was 1.13% in 2024, and payout ratio reached 42.45%. The year before the numbers were 1.09% and 42.64% correspondingly. See high-dividend stocks and find more opportunities for your portfolio.
As of Nov 13, 2025, the company has 4.35 K employees. See our rating of the largest employees — is Gland Pharma Ltd. on this list?
EBITDA measures a company's operating performance, its growth signifies an improvement in the efficiency of a company. Gland Pharma Ltd. EBITDA is 13.89 B INR, and current EBITDA margin is 22.87%. See more stats in Gland Pharma Ltd. financial statements.
Like other stocks, GLAND shares are traded on stock exchanges, e.g. Nasdaq, Nyse, Euronext, and the easiest way to buy them is through an online stock broker. To do this, you need to open an account and follow a broker's procedures, then start trading. You can trade Gland Pharma Ltd. stock right from TradingView charts — choose your broker and connect to your account.
Investing in stocks requires a comprehensive research: you should carefully study all the available data, e.g. company's financials, related news, and its technical analysis. So Gland Pharma Ltd. technincal analysis shows the sell today, and its 1 week rating is sell. Since market conditions are prone to changes, it's worth looking a bit further into the future — according to the 1 month rating Gland Pharma Ltd. stock shows the buy signal. See more of Gland Pharma Ltd. technicals for a more comprehensive analysis.
If you're still not sure, try looking for inspiration in our curated watchlists.
If you're still not sure, try looking for inspiration in our curated watchlists.