GMMPFAUDLR, TRADE ANALYSIS - HOW WE TRADED 300+ POINTS MOVEGMMPFAUDLR was given for buy above 4360 at 10:16AM when it was trading at 4360. Once it broke our level, it moved like crazy (yes, this is one of my crazy watchlist stock) and gave us much expected 300+ points.
Our target for this was 4570/4600 which it crossed very easily.
Thanks
Piyush Gupta
Learn & Earn
GMMPFAUDLR trade ideas

GMMPFAUDLRReady to come out of rectangular pattern .MACD crossover and RSI adding to the strength.
stock has consolidated well .upside is on now

PositionalMentioned in the chart. Market leader. Due to the current market scenario, may even test 3935 and then bounce for the target.
Note: Educational purpose only.

GMM:Weekly consolidation and breakout, retest with lower volumeAll levels are marked on the weekly chart.
DISC: For educational purposes only.

watch for resistance breakoutbuy above 4575 resistance around 4635 and 4740
it can be a good trade in swing as well.


GMM- Can it go bigGMM in the process of breaking out of weekly cup and handle pattern. Can have swift move upto 5300 and if sustained 6500 and more. Keep a close watch

GMMPFAUDLRGMMPFAUDLR (Weekly):- Buy on 4000/4100 best Buy Zone For Target 5000/5800++ Invalid Below 3700 (DCB)
#Disclaimer:-I just shared view for only educational purpose.
#priceaction #GMMPFAUDLR #CHARTS_INSIDERS

GMM Pfaudler breakout and retestBSE:GMM
Fundamentals -
Average ROE for last 3,5,7,10 years > 15% (greater than 15 is good)
Sales and Profit 5 year CAGR 14% and 31% respectively (double digit growth and profit growth better than sales growth is good)
Debt to equity at 0.16 (less than 1 is good), Interest coverage at 19.7 (greater than 3 is good), current ratio at 2.57 (greater than 1.5 is good)
Consistent dividend payer since 2009
Free cash flow to Cash flow from operations percentage is at 50.2%, means it's a cash rich company.
Other important points -
1) GMM Pfaudler (GMM) is the market leader of glass lined equipments in India with over 50% market share.
2) On June 30, 2020, GMM Pfaudler announced that it has agreed into a binding agreement with De Dietrich India (DDPS India) for the acquisition of the latter’s sole Indian manufacturing facility located in Hyderabad. DDPS is a global leader in glass lining equipments.
All in all a financially stable company with good future growth prospects.
Broken out above resistance levels of Rs.4040 and Rs.4177 recently with good volumes after consolidating for 4.5 months, came down up to the breakout point and now trying to move up again. 50 day EMA just crossed 200 day EMA. If crosses Rs. 4428, can go to much higher levels. Stop loss will be below Rs.4000.

GMM PFAUDLERAnother good stock
will give about 300-500 in short term per stock
Just for educational purpose only.

GMM PFAUDLEROn a weekly Chart, looks like a break out.
For patient investors, target 6000 in times to come.
FOR EDUCATIONAL PURPOSE ONLY.

GMMPFAUDLER resistance at 4600GMMPFAUDLER facing reistance at 4600, it could retest 4000-4200 levels where it has given breakout.
Daily RSI is at 80 which is overbrough zone. expecting some pull back in it.
either it could reach 5000 without retest or it may retest breakout level followed by reaching 5000 level


GMMPFAULDER TRADE ANALYSIS - HOW WE CAPTURED 10% MOVE TODAYDetailed explanation in the video about selection criteria, entry & exit levels.
Happy learning.
Thanks
Piyush Gupta
Learn & Earn


GMM Pfaudler in the show againWhat is your view on this tell me in comments.
01. completed Consolidation
02. Monopolistic business model
03. Good fundamentals
04. almost 40% - 50% discounted rate from 52W high
05. For educational purpose only
add in your watchlist


GMMPFAUDLR is nearing to its PRZHarmonic BAT Pattern formed in GMMPFAUDLR. The price of reversal is indicated in the chart.

GMM PFAUDLERIn weekly time frame after making a Bullish Hidden Divergence near an Ichimoku Kumo it has now activated a Bullish C Clamp. It has strong support near 3600 with minor resistance at 3900. Probable upside for 4600 and then 5100. View negates below 3500


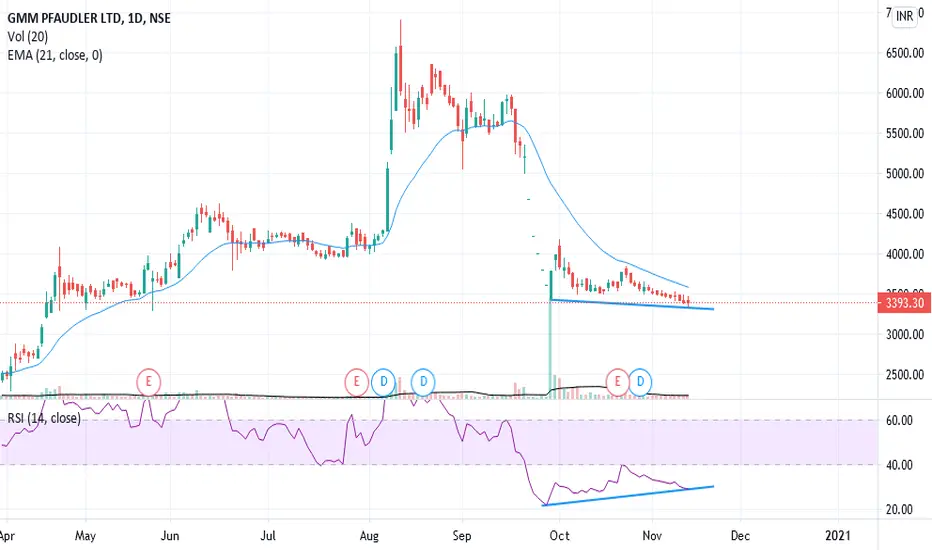
RSI divergence in GMM PfaudlerRSI divergence in GMM Pfaudler. Friends, please give your opinion how will the stock react to this??
GMM Faudlr looks very bearish....be careful!GMM looks very bearish.....see the red candles last two months....Both RSI and OBV are weak and pointing down.......further fall is seen upto 38.2% or even further down to touch the yellow trendline........be careful..
