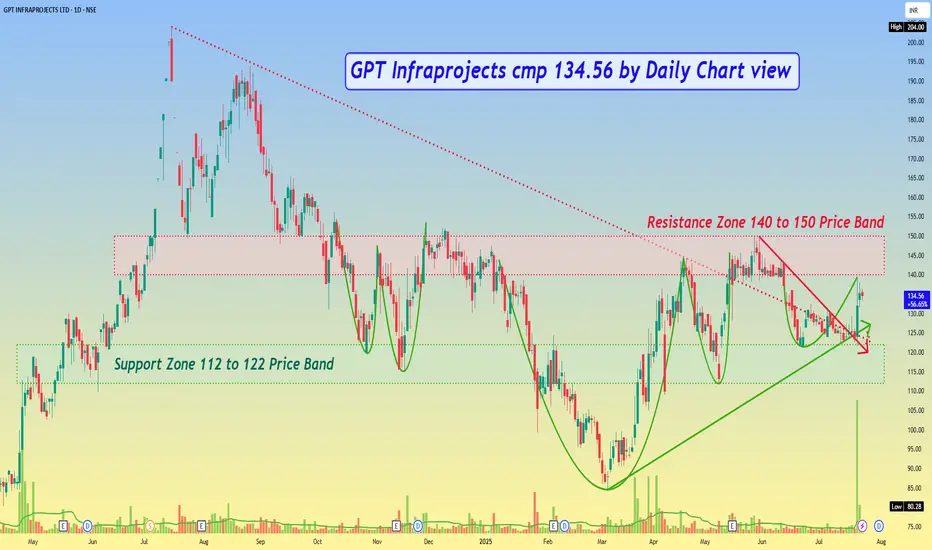
GPT Infraprojects cmp 134.56 by Daily Chart viewGPT Infraprojects cmp 134.56 by Daily Chart view
- Support Zone 112 to 122 Price Band
- Resistance Zone 140 to 150 Price Band
- Support Zone tested and retested well before breakout
- Falling Resistance Trendline from ATH broken and sustained
- 2nd recent Falling Resistance Trendline Breakout too seems sustained
- Heavy Volumes surged seen over past 2 days by demand based buying
- Bullish Rounding Bottoms by Resistance Zone neckline indicate upside momentum readiness
GPTINFRA trade ideas
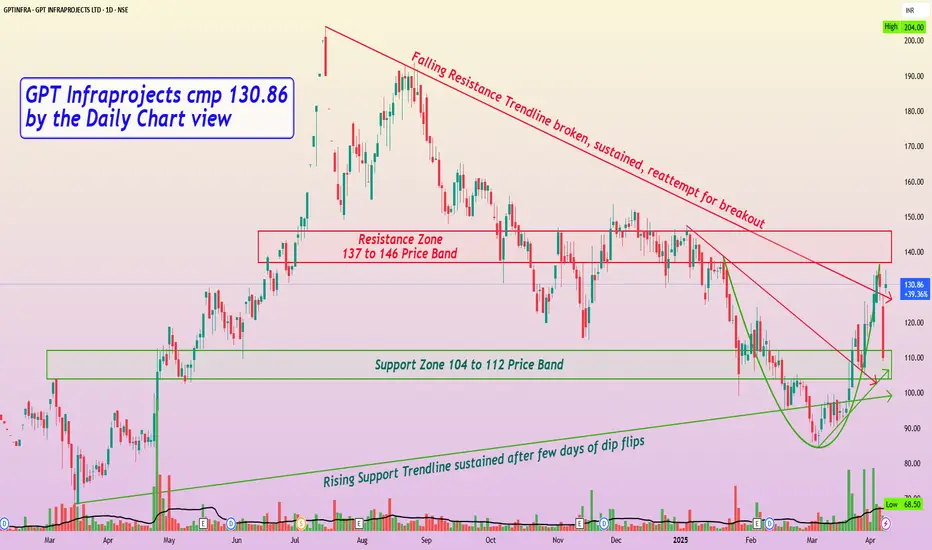
GPT Infraprojects cmp 130.86 by the Daily Chart viewGPT Infraprojects cmp 130.86 by the Daily Chart view
- Support Zone 104 to 112 Price Band
- Resistance Zone 137 to 146 Price Band
- Rising Support Trendline sustained after few days of dip flips
- Falling Resistance Trendline broken, sustained, reattempt for breakout
- Bullish Rounding Bottom completed but contained at Resistance Zone neckline
- Volumes have been seen surging very heavily intermittently, over past few days
- *Subject to Breakout and sustained closure above Resistance Zone, fresh upside maybe anticipated*
GPT InfraUpdated Study for myself
Amazing Company and Amazing Charts !!!
Ready to Achive targets 1 and 2 absolutely fast ..


GPT INFRAPROJECTS - Awaiting breakoutAfter a flag breakout there was a reasonable consolidation happening .
It is time for a move here.


Weekend Pick 3: GPT Infra - Cup and Handle Bullish BreakoutGPT Infra
Fundamentally strong, FIIs have added a stake in the last quarter!
Technically it looks very bullish, broken big C&H bullish pattern.
R 1: 160
R 2: 185
R 3: 220
S : 110
R - Resistance
S - Support

GPTINFRA very bullish chart on all TFThe chart is Super Bullish on all Time Frames.
Plan is simple to add on retest or retest breakout as per comfort and market scenario.
Can give minimum of 50% returns in 6-12 months !!

Box BO#GPTInfra CMP 118
Good BO after long consolidation.
Seems ready for 140/160/180
Showing good sales and EPS growth

GPTInfra: Ascending triangle breakout on weekly time frameGPTINFRA is looking good for long. On weekly time frame, ascending triangle breakout can be seen. Keep on radar.

GPTINFRA - Cup & Handle pattern formNSE:GPTINFRA BSE:GPTINFRA
Time Frame – Weekly
Technical Observations –
1) Cup & Handle pattern form
2) Breakout above 105-115 zone
3) High volume seen
Resistance – 147.90 / 187.35 / 220.80 / 248
Support – 67.50 & Weekly 200 SMA
DISCLAIMER : NCFM Certified Technical Analyst. I am not SEBI registered analyst. All posts are for educational purpose only. I am not responsible for your any loss or profit. Consult your adviser before taking any trade. I help people to learn technical analysis & charts reading.

GPT INFRAWatch GPT INFRA on a weekly timeframe.
It has been forming a cup and handle pattern. It has seen trying to break from the descending channel today. It might breakout of the channel in the upcoming days. If it breaks the channel and stays above 90-100 levels we can see price moving to 150 levels.
Please note that I am not a sebi registered analyst.
Please analyse your self before investing.

Flag pattern...On verge of breakout !!Stock after gaining whopping 170% in just 2 months (May - July) has consolidated and is on verge of breakout from flag pattern on weekly chart in coming days, weeks. One can consider long position with SL 75 on weekly CB or wait for the price to close above the upper trend-line and ride the trend. Targets mentioned on chart, as those levels acted as resistance in its downfall. As this is positional trade, targets may come in couple of months or more.
Kindly do your analysis before initiating any trades.

Subbus Breakout Rounding Bottom Pattern
GPT Infra
entry levels on retesting levels 82
SL=59.3
1st Target=111.4
2nd Target=151.9
If breakout above 111.4 in this week with huge volumes on DCB can go for buying, aiming target of 151.9. SL remain intact.


[SHORT TERM INVESTMENT] GPT INFRAPROJECTSThe stock looks good to buy for a quick 10-20% quick profit.
To motivate me, Please like the idea If you agree with the analysis.
Happy Trading!
InvestPro India Team


