200 ema breakout and retestGranules looks to be going up after crossing 200 ema. Also previous resistance breakout and retest current.
Trade ideas
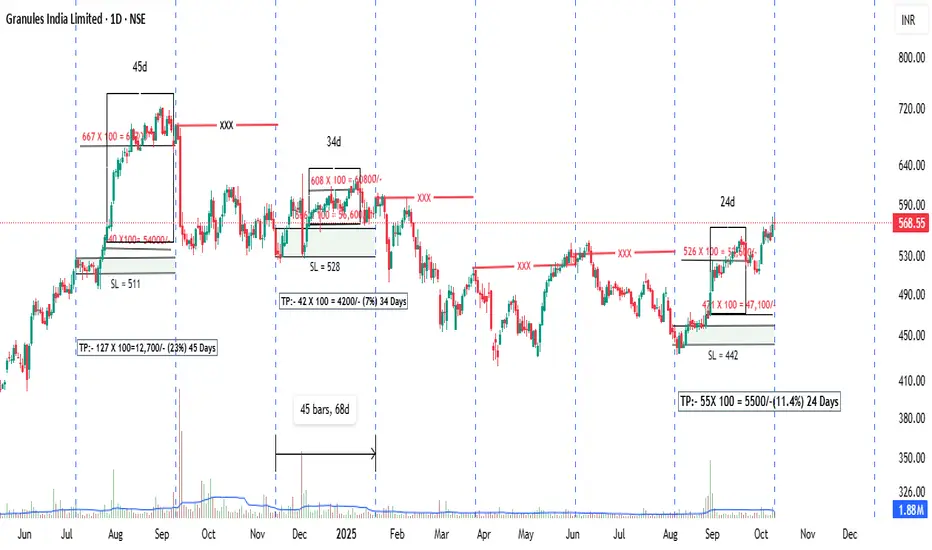
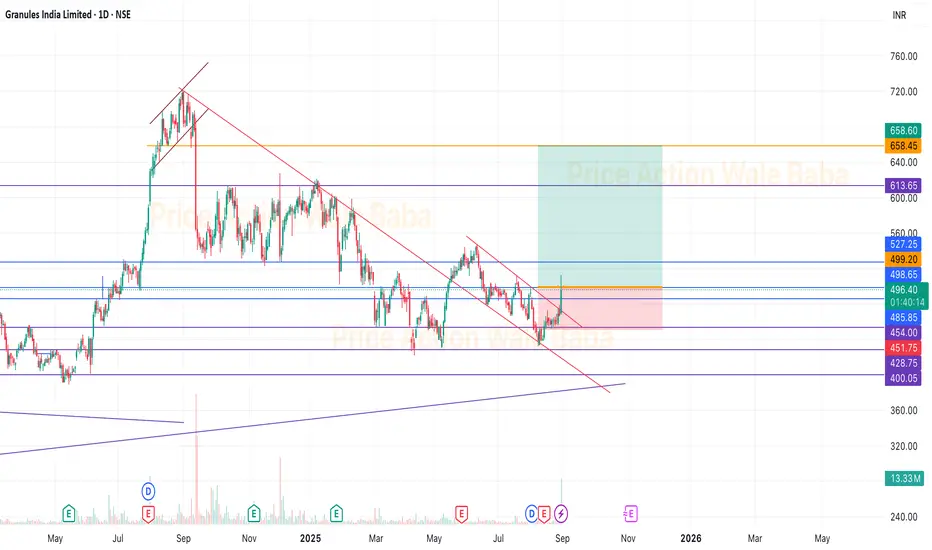
Cycle trading practice in GRANULES ChartHello friends, today again we will discuss a little about how to trade the chart of a time cycle and how to make profit in it.
The effort will be to understand things, and if we do not do it practically, it becomes a little difficult to understand. Let us see today what happened in the last 7 cycles on the chart of GRANULES.
Please pay a little attention, the stock is not in futures(FNO), trading can only be done in the cash market.
Due to this, trades will not be possible in the down cycle. You can see in the chart that out of the last seven cycles, only buy trades were made in three cycles, which could not be traded in the four cycles due to the down trend.
Let me explain how to trade one more time.
You need to mark the high end of the time cycle candle. When the price closes above the high, at least one green candle of the day must close above the time cycle candle.
You can set price alerts in TradingView, and if you receive an alert after 3:15 PM, you can take a trade that day also before market closing. Your stop loss will be the low of the Time Cycle candle.
Now just see, in the July to September 2024 cycle, you got trade for only 45 days in 68 days and generate gain of 23% with 1.5 Month.
Again in November to January,2025 time cycle you will get 7% profit from small trade within 34 days.
And in the current cycle from August to October 2025, traders will give you 11% profit within 24 days.
And the most interesting thing is that today its cycle date ( 10th October) and you can see if you plot it in Game Fun then this stock is currently going in uptrend . This cycle can also give you a good buying opportunity.
I hope Granules next price target is 640 to 667 within next cycle.
I hope you all liked my effort. If you have any question on time cycle, write it down and we will try to answer your question correctly.
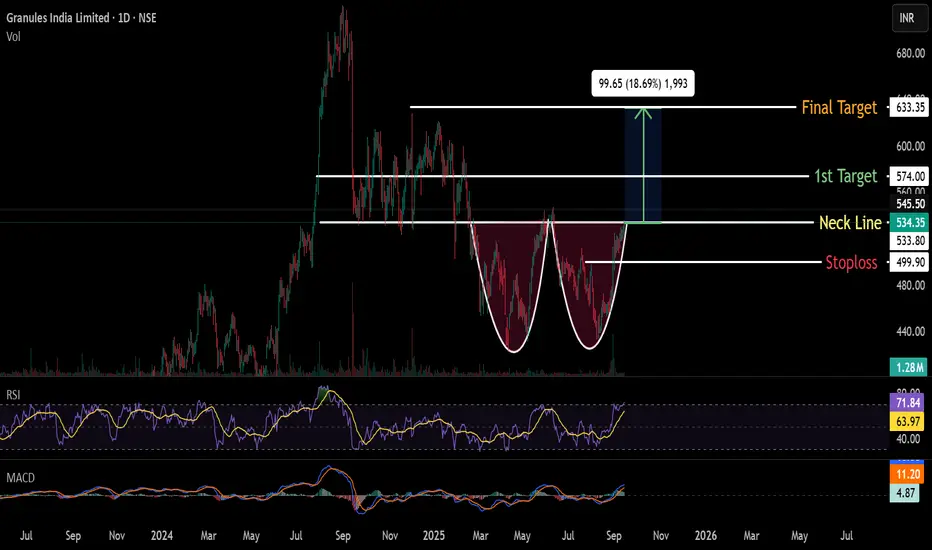
Double Bottom Formation on Granules India ..Near Breakout LevelGranules india forming Double bottom pattern on Daily & weekly charts & Near Neck line area ( Breakout level 535 ) ..Stock is currently trading above all important moving averages (50,100,200).RSI & MACD also indicating positive momentum..If break out happened possible target will be 570 & 630 in near term with a stoploss of 500 Rs.
It's not a buy or sell call ...For education purpose only.
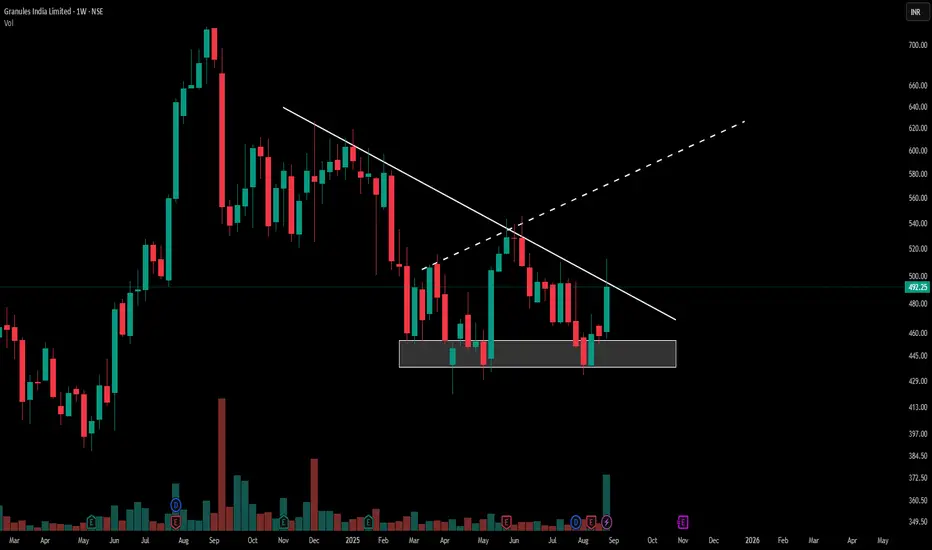
Granules India: Critical Descending TriangleGranules India Limited presents a descending triangle pattern on the weekly chart. The price has moved from the established support zone near ₹440-450 and is currently challenging the resistance trendline around ₹492.25. This movement appears with a marked increase in trading volume, highlighting the level where buyers and sellers are most active.
Pattern Character
A descending triangle pattern is identified by a series of lower highs against a stable support base. Granules India’s recent action displays persistence at support and upward momentum toward resistance. The volume expansion indicates notable participation during the current move.
Chart Observation
Price action above the triangle’s resistance can indicate a change in the prevailing sentiment if confirmed by continued volume. The current structure and market activity are being closely watched by participants for further development. No forecast or recommendation is made within this post.
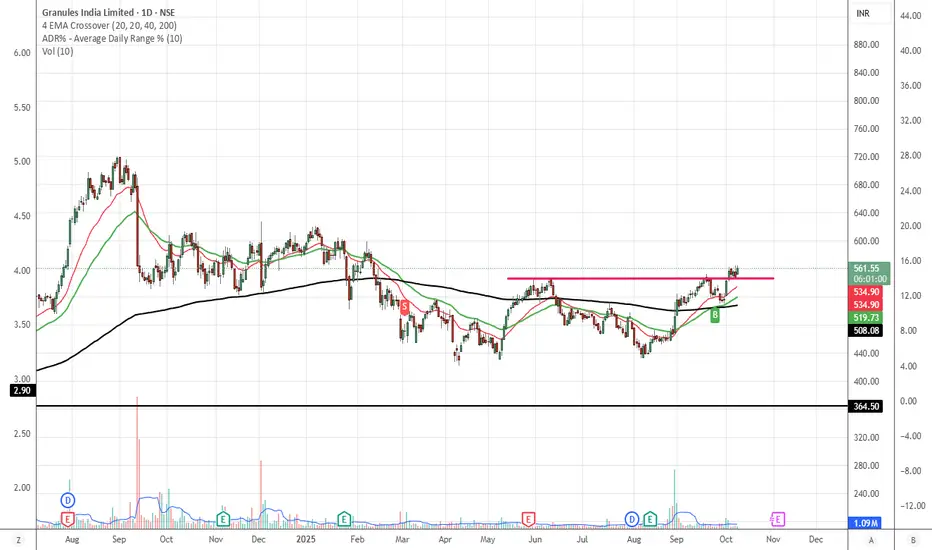
Granules - BreakoutGranules has give good breakout with volume and proper consolidation.
Above 520, we can see proper rally in the stock and good to hold for the long term.
Keep buying on every dip and wait for the next 3-6 months for the good returns.
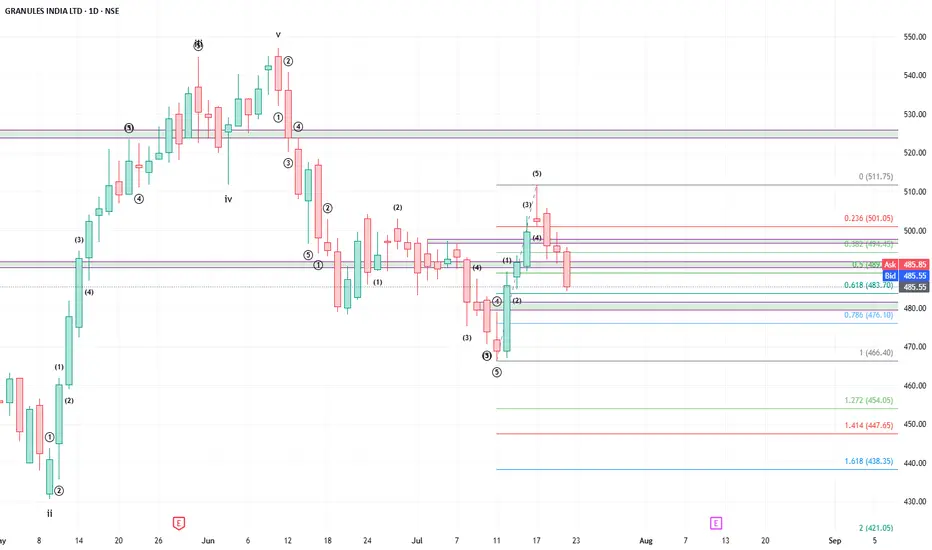
Buy Granules at 483/476 levels, target 545
Granules had completed corrective wave structure of the previous impulse in the form of a zigzag as given in the chart and has since been forming new impulse wave.
Stock has completed wave 1 of lower degree and has been correcting providing a buying opportunity. Stock may take support at 0.618 to 0.786 levels.
Buy in the range of 483 / 476 levels for a target price of 545 or higher. Maintain stop loss of 472
Will revise the targets as the impulse wave continues.
Happy Trading!!
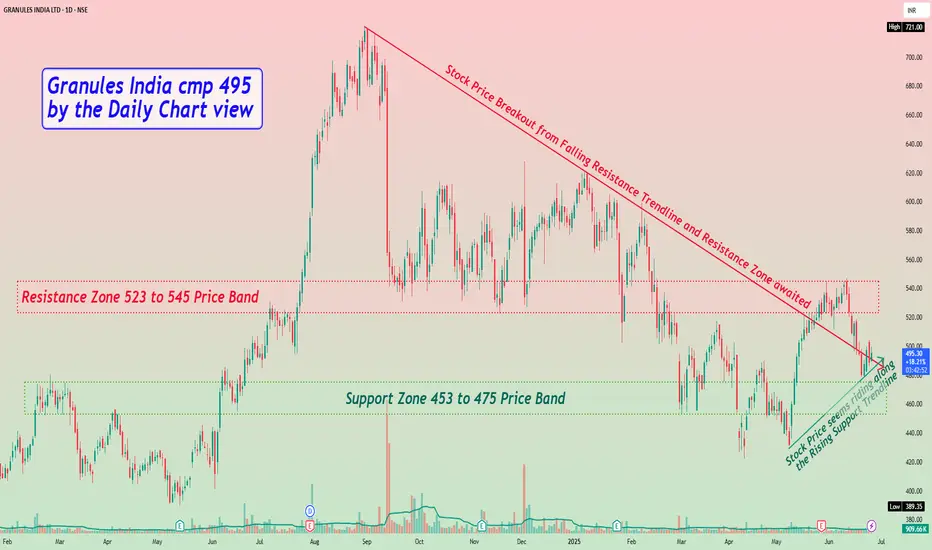
Granules India cmp 495 by the Daily Chart viewGranules India cmp 495 by the Daily Chart view
* Support Zone 453 to 475 Price Band
* Resistance Zone 523 to 545 Price Band
* Stock Price seems riding along Rising Support Trendline
* Stock Price Breakout from Falling Resistance Trendline and Resistance Zone awaited
* Stock has been attempting Breakout above Resistance Zone couple of times in June 2025 but has failed yet to make it
Granules - Double Bottom Breakout Double Bottom Breakout and Retest Done
Buy @ 495-497
SL 475
Target - 585
Resistance Trendline Breakout as well !!
GRANULES: Hard to Ignore Trade Setup!⚡ Price Analysis:
1️⃣ Price structure is turning bullish.
2️⃣ Strong rejection candle formation near the support area, showing that the price is rejecting from lower levels.
3️⃣ Price needs to HOLD above 500 to continue the upmove
⭐ Key Observations:
➡️ Good Reversal Potential
➡️ Anticipating a strong trendline breakout to get more strength.
➡️ RRR is favourable.
⚠️ Disclaimer: This is NOT a buy/sell recommendation. For learning ONLY. Views are personal. Please, do your due diligence before investing.⚠️
🍀Cheers! 🔥

Granules India LtdDate 23.05.2025
Granules
Timeframe : Day Chart
Technical remarks :
1 Neutral as of now but at critical chart set-up
2 Strong breakout above 200 ema + 544 + Ichimoku cloud breakout
3 Weak breakdown below 200 ema + 489 + Ichimoku cloud breakdown
About
Granules India Ltd and its subsidiaries are primarily involved in the manufacturing and selling of Active Pharma Ingredients (APIs), Pharmaceutical Formulation Intermediates (PFIs) and Finished Dosages.
Business Segments
1 Finished Dosages (64% in FY24)
2 Active Pharmaceutical Ingredients (API) (22% in FY24)
3 Pharmaceutical Formulation Intermediates (PFI) (14% in FY24)
Geographical Split
The company has a presence in 80+ countries across the world.
1 North America: 66%
2 Europe: 19%
3 India: 5%
4 LATAM: 5%
5 ROW: 5%
Regards,
Ankur

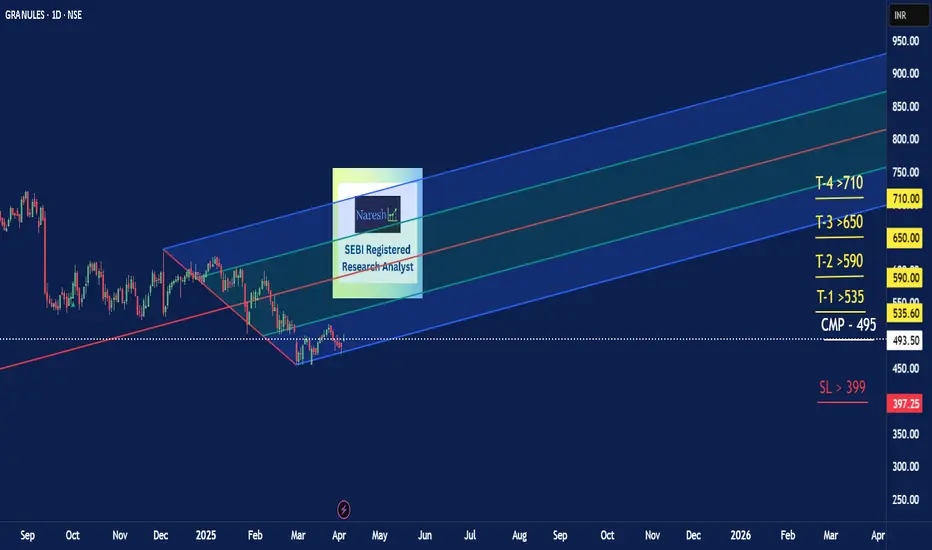
Positional Cash Trade - Avoid Option TradesGRANULES
CMP 490
Buy on Dips > Levels mentioned in the Chart
SL CLB & Probable Targets also mentioned in the chart
Follow the Levels & Avoid Option Trades - For your own good
Maintain TSL to maximize your gains
Lets hope it'll move as per our expectations
if you like this idea 💡 --- Plz don't miss to Boost 🚀
For more info - Plz visit my profile & Follow me
Rgds,
Naresh G
SEBI Reg.RA
Positional Trade -- OPTIONS Trade not advisable Granules
cmp 575
Buy on dips till 520
SL CLB 490
Targets 625-725 & probably more
Plz dont forget to boost this idea & for more info, you can visit my profile
Rgds,
Naresh G
SEBI Reg. RA

Watch for reversal signalsGranules CMP 461
Elliott- a correction that starts with a big bear candle or an inverted V types are generally the first leg of the fall. This is a typical zig zag corrective pattern. The weakness was a lot and hence the retracement was very less. I remember speaking about the weakness.
the stock is now down to a strong support as it is at fib and trendline support. I will want to see some reversal signals here. In my view its a high prob reversal zone.

Granules, Free fall?While struggling to break 613 in daily granules also was forming lower highs since the beginning of this year.
Recently it broke the box support at 530 and opened gap down today.
It is in a bad shape.

Granules india ltd### **Comprehensive Analysis of Granules India Ltd (NSE: GRANULES)**
#### **1. Fundamental Analysis:**
**Overview:**
Granules India Ltd is a leading pharmaceutical manufacturer based in India, engaged in the production of active pharmaceutical ingredients (APIs), pharmaceutical formulations, and drug intermediates. The company is known for its strong presence in the global pharmaceutical market and has a diverse product portfolio across various therapeutic segments, including pain management, cardiovascular diseases, and anti-diabetics.
**Key Financials (as of latest available data):**
- **Market Capitalization**: ₹16,330 crore (as of Feb 2025)
- **Revenue Growth**: Granules India has shown consistent growth in revenue driven by the rising demand for generic drugs, expansion in the U.S. and European markets, and solid growth in both domestic and international markets.
- **Profitability**: The company has demonstrated strong profitability margins with a stable net profit margin in recent quarters. Granules India’s focus on high-value APIs and formulations allows for higher margins.
- **Debt Levels**: Granules has a relatively low debt-to-equity ratio, which is favorable for its financial stability. The company has been successful in reducing debt over the years, contributing to its ability to generate strong cash flow.
**Recent Developments:**
- **Acquisitions and Expansion**: Granules India continues to expand its manufacturing capacity and distribution networks, particularly in the U.S. and European markets. The company has also ramped up its research and development (R&D) activities, focusing on complex generics.
- **Regulatory Approvals**: Granules India has received multiple approvals from the U.S. FDA for manufacturing formulations and APIs, which has contributed to the growth in exports.
**Key Strengths:**
- Strong portfolio of APIs and formulations, with a significant presence in global markets.
- Diversified customer base, including leading pharmaceutical companies.
- Consistent focus on R&D and expanding its product offerings.
- Robust balance sheet with low debt.
**Risks:**
- **Regulatory Risks**: The pharmaceutical industry is heavily regulated, and any regulatory setbacks (e.g., delays in approvals or compliance issues) could impact operations, especially in international markets like the U.S. and Europe.
- **Competition**: Granules faces significant competition in the generic drug market, particularly from larger multinational pharmaceutical companies.
- **Currency Fluctuations**: Being an export-oriented company, Granules India is exposed to foreign exchange risks, especially as the majority of its revenue comes from the U.S. and European markets.
---
#### **2. Technical Analysis:**
**Current Price Action (as of February 2025):**
- **Stock Price**: ₹306 (as of Feb 2025)
- **52-week High/Low**: ₹415 (High) – ₹292 (Low)
- **Recent Trend**: Granules India has experienced some volatility over the past year, with a noticeable downward correction after hitting its 52-week high. The stock has been in a consolidation phase recently, with support forming around the ₹300 mark.
**Moving Averages:**
- **50-Day Moving Average (50-DMA)**: ₹308
- **200-Day Moving Average (200-DMA)**: ₹356
- Currently, Granules is trading below both the 50-DMA and 200-DMA, which suggests a bearish trend in the short-to-medium term. The stock has been testing the 50-DMA as resistance in the recent past.
**Relative Strength Index (RSI):**
- RSI is at **41**, which indicates that the stock is not in the overbought territory but is leaning toward the oversold zone. This suggests the stock could be a potential buy if it starts to show signs of stabilization and reversal.
**MACD (Moving Average Convergence Divergence):**
- The MACD line is currently below the signal line, which points to a bearish signal. If the MACD crosses above the signal line, it could be an indication of a reversal toward bullish momentum.
**Volume Analysis:**
- The volume is showing signs of increasing during price corrections, which suggests that there is interest in buying the stock at lower levels. A spike in volume during an upward breakout could confirm a potential price rally.
---
#### **3. Support and Resistance Levels:**
**Support Levels:**
- **₹290-300**: This range has acted as strong support during recent corrections. A breach of this support could indicate further downside potential.
- **₹275**: This level is another key support to watch if the stock breaks below the ₹300 level. A bounce off ₹275 would be an encouraging sign for bulls.
**Resistance Levels:**
- **₹320**: The immediate resistance for the stock is around ₹320. If the stock manages to cross this level and sustain it, it could trigger an upward momentum.
- **₹350-360**: The stock faces stronger resistance in the range of ₹350-360, which corresponds to the 200-DMA. A break above this resistance could signal a trend reversal.
**Key Levels to Watch for Short-Term Movement:**
- **Immediate Resistance**: ₹320 (50-DMA)
- **Immediate Support**: ₹290 (recent low)
---
#### **4. Risk and Reward Outlook:**
**Risk Factors:**
- **Regulatory Risks**: As Granules India depends on regulatory approvals for its products, delays or rejections could impact revenue generation, especially in international markets like the U.S.
- **Market Volatility**: The pharmaceutical sector is subject to government pricing pressures and regulatory risks, which could affect profitability.
- **Currency Risks**: Granules is exposed to currency fluctuations since a significant portion of its revenue comes from exports, primarily to the U.S. and Europe.
**Reward Potential:**
- The stock offers a good upside potential in the medium-to-long term if the global demand for generics and APIs continues to rise.
- Granules has a solid financial base, low debt, and a diverse product range, which bodes well for future growth, especially if it can scale up its R&D efforts.
---
#### **5. Investment Recommendation:**
- **Long-Term Investors**: Granules India offers a promising growth story due to its strong presence in the generic drug market and its expanding global footprint. Investors who are looking for exposure to the pharmaceutical sector could consider buying the stock at current levels, especially if it reaches the support range of ₹290-300.
- **Short-Term Traders**: For traders, it's advisable to wait for a breakout above ₹320 for confirmation of upward momentum. A breakdown below ₹290 could trigger a further decline in the stock.
---
### **Disclaimer:**
The information and analysis presented here are for educational and informational purposes only. We are not registered with SEBI (Securities and Exchange Board of India) or any other regulatory body, and this should not be construed as investment advice. Stock market investments are subject to market risks, and past performance is not indicative of future results. Before making any investment decisions, it is important to conduct thorough research, seek advice from a certified financial advisor, and understand your risk tolerance. The views expressed are based on publicly available data and personal analysis, and may not necessarily reflect the views of other professionals or organizations.


GRANULES - HORIZONTAL CHANNEL - DAILY CHARTIt is again at upper Resistance trendline for the 5th time, RSI constantly moving up even when the stock price dipped in between. There is probability of Breakout. It may give good reward.
Keep your eyes on it.
If you like my analysis, please follow me as a token of appreciation :)
in.tradingview.com/u/SatpalS/
For learning and educational purposes only, not a trading advice. Pls consult your financial advisor before investing.

Granules India cmp 605.00 by Daily Chart viewGranules India cmp 605.00 by Daily Chart view
- Support Zone 523 to 538 Price Band
- Stock Price seems riding along the Rising Support Trendline
- Stock seen consolidating in trading range 530 to 612 Price Band
- Stock Price below Falling Resistance Trendline awaiting a breakout
- Volumes seen subdued, below avg traded quantity, needed for a breakout

Breaksout Stock: Granules IndiaGranules India is trading in a Box Pattern since Mid Sept 2024.
Currently it is trading below the strong resistance level of 610.
20 EMA (Black line) is above the 50 EMA (Orange line), indicating the momentum in the stock price.
However, the box pattern has to be decisively broken in the weekly chart to confirm the bullishness.
Resistance levels: 610, 664, 696, 721
Support levels: 527, 493, 453

Short_GranulesHi Traders,
Short Entry at Granules with news bases trades.
speculations say that US raised 6 observations from from Major Plant which gives 70% of revenue from that plant.
Read Chart for more description.
Happy trading!!Only for educational purpose.

GRANULES DOUBLE BOTTOM BREAKOUTGranules breaking double bottom reversal pattern
with good volume building up
trading above 20ema
breaking 612 will give strength
#target 721,sl 530
NO BUY/SELL RECOMENDATION

GRANULES Trading Above Fresh Weekly Demand Zone GRANULES is currently trading at ₹533.9, slightly above its demand zone between ₹523.5 and ₹500.65, established on 2nd August 2024. This fresh zone remains untested, indicating potential buying interest if the price revisits this range. Investors may monitor for a pullback towards this zone, which could offer a buying opportunity with strong support.

Wyckoff - postional trade in GranulesGranules has completed wyckoff in hourly chart and set to itself for trend moves. Relative strength speak same.
