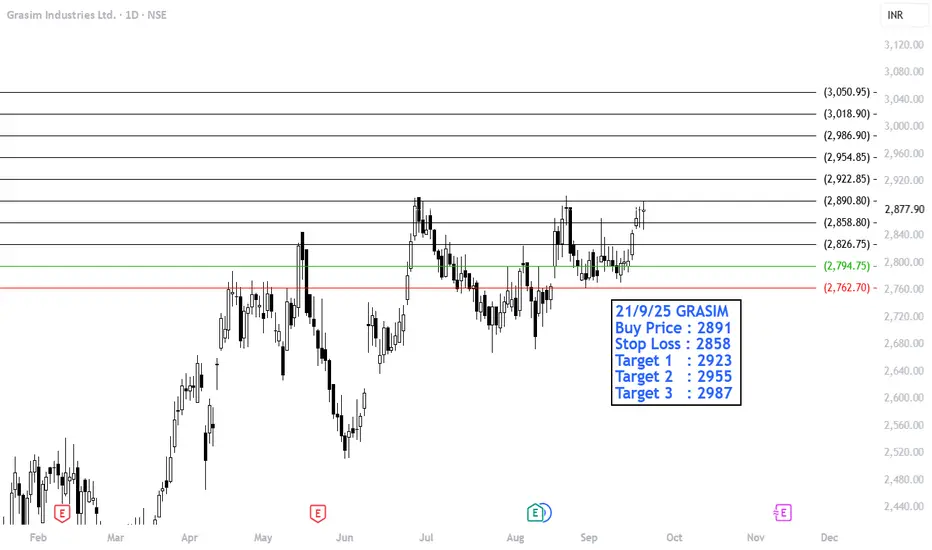
BUY GRASIM21/9/25 GRASIM
Buy Price : 2891
Stop Loss : 2858
Target 1 : 2923
Target 2 : 2955
Target 3 : 2987
GRASIM trade ideas
Moving ahead to ATH_Grasim Industries Ltd. 🔎 Technical Chart Analysis (Weekly)
1. Price Structure & Trend
The stock has been in a primary uptrend since mid-2023, making higher highs and higher lows.
After consolidating between ₹2,400 – ₹2,800 for several months in 2025, the stock is now attempting a breakout.
2. Resistance & Support Zones
Immediate Resistance (Breakout Level): ~₹2,885 (marked by the dotted red line).
Immediate Support: ₹2,700 (recent swing low).
Strong Support Zone: ₹2,450–₹2,500 (historical demand area).
3. Candlestick Behavior
Recent candles show bullish momentum with higher closes and strong weekly gains (+2.71%).
Multiple rejections around ₹2,880 in the past suggest a supply zone, but repeated retests increase breakout probability.
4. Volume & Momentum
If breakout occurs with high volumes, price may sustain above ₹2,900.
5. Chart Pattern
The structure resembles a Cup & Handle / Rectangle Consolidation, both bullish continuation patterns.
A weekly close above ₹2,885 can confirm breakout, opening room for further upside.
📈 Possible Scenarios
✅ Bullish Case:
Sustained breakout above ₹2,885 may push the stock toward ₹3,050 – ₹3,150 (measured move projection).
Stronger momentum could extend rally to ₹3,300+ in medium term.
⚠️ Bearish Case:
Failure to cross ₹2,885 may lead to another pullback toward ₹2,700.
Breakdown below ₹2,700 can drag price back to ₹2,500 zone.
📝 Analyst View (Summary)
Trend: Bullish (Primary Uptrend intact)
Key Level to Watch: ₹2,885 (Weekly breakout level)
Bias: Positive above ₹2,700 support
Medium-term Target (if breakout holds): ₹3,050 – ₹3,150
⚠️ Disclaimer
This analysis is for educational and informational purposes only and should not be considered investment advice or a recommendation to buy/sell. Stock markets are subject to risks. Please consult with financial advisor before making any investment decisions.

Flexing at All Time HighGrasim broke a cup & handle pattern and came down, again trying to break another trendline at top of the cup & handle pattern. if it breaks and sustain above the latest breakout with good volume, it'll move up for sure.
***This is only for educational purposes***
Grasim: 25-Year Growth Story Reaches New HeightsTechnical Analysis
Grasim Ltd presents one of the most remarkable long-term growth stories in Indian markets. Having tracked this stock since 1999 when it traded below ₹20, the journey has been extraordinary. From those humble levels, the stock demonstrated a steady bullish rally reaching ₹2,880 by July 2024, representing a phenomenal 144x growth over 25 years.
Post the July 2024 peak, the stock corrected to below ₹2,300 levels. However, following massive FY2025 results, the stock regained momentum and created a new all-time high at ₹2,896. This establishes the ₹2,800-₹2,900 zone as a strong resistance area that has been tested multiple times.
Currently trading at ₹2,811, the stock is consolidating near the resistance zone. A decisive breakout above this supply zone with confirmation through bullish candlestick patterns would signal the next leg of the rally.
Entry Strategy: Wait for breakout above ₹2,900 zone with volume confirmation and bullish patterns.
Targets:
Target 1: ₹3,000
Target 2: ₹3,100
Target 3: ₹3,200
Stop Losses:
Minor Support: ₹2,600-₹2,700 (minor demand zone)
Major Support: ₹2,200-₹2,300 (strong demand zone)
If ₹2,200-₹2,300 zone is taken down, no more expectations on this stock.
Q1 FY26 Financial Highlights (vs Q4 FY25 & Q1 FY25)
Total Income: ₹40,118 Cr (↓ -9% QoQ from ₹44,267 Cr; ↑ +16% YoY from ₹34,610 Cr)
Total Expenses: ₹31,296 Cr (↓ -12% QoQ from ₹35,517 Cr; ↑ +12% YoY from ₹27,927 Cr)
Operating Profit: ₹8,822 Cr (↑ +1% QoQ from ₹8,750 Cr; ↑ +32% YoY from ₹6,682 Cr)
Profit Before Tax: ₹3,834 Cr (↓ -4% QoQ from ₹3,996 Cr; ↑ +42% YoY from ₹2,691 Cr)
Profit After Tax: ₹2,767 Cr (↓ -7% QoQ from ₹2,973 Cr; ↑ +34% YoY from ₹2,066 Cr)
Diluted EPS: ₹20.85 (↓ -5% QoQ from ₹21.98; ↑ +28% YoY from ₹16.33)
Fundamental Highlights
Grasim Industries delivered robust Q1 FY26 performance with consolidated revenue rising 16% YoY to ₹40,118 crore, EBITDA growing 36%, and PAT climbing 32%. The company crossed the significant ₹1.5 lakh crore TTM milestone with standalone revenue surging 34% YoY to all-time high of ₹9,223 crore.
Market cap stands at ₹1,91,225 crore (up 2.37% in 1 year) with promoter holding at 43.1%. Stock reached all-time high of ₹2,896.55 before current consolidation, demonstrating strong momentum.
Key growth drivers include diversified business portfolio spanning Cellulosic Fibre, Chemicals, Cement, and new ventures. Birla Opus paints brand targets ₹10,000 crore gross revenue within 3 years, positioning to become the second-biggest player in the ₹80,000 crore decorative paints market.
Cellulosic Staple Fibre revenue grew 7% YoY with domestic volumes higher by 2% YoY, while Chemicals EBITDA surged 36% YoY. The strong performance across segments validates the diversification strategy.
Strong subsidiary performance from UltraTech Cement and Aditya Birla Capital continues to drive consolidated growth, with management expressing confidence in sustained momentum across all business verticals.
Conclusion
Grasim's remarkable 25-year journey from sub-₹20 levels to ₹2,896 all-time high, backed by strong Q1 FY26 fundamentals showing 32% PAT growth and ₹1.5 lakh crore TTM milestone, validates the long-term growth thesis. The ₹10,000 crore Birla Opus paints target and diversified portfolio provide multiple growth engines. Breakout above ₹2,900 resistance could trigger the next rally toward ₹3,200 levels. Key support zones at ₹2,600-₹2,700 and ₹2,200-₹2,300 provide risk management levels.
Disclaimer: lnkd.in

Grasim: 25-Year Growth Story Reaches New Heights🔍 Technical Analysis
Grasim Ltd presents one of the most remarkable long-term growth stories in Indian markets. Having tracked this stock since 1999 when it traded below ₹20, the journey has been extraordinary. From those humble levels, the stock demonstrated a steady bullish rally reaching ₹2,880 by July 2024, representing a phenomenal 144x growth over 25 years.
Post the July 2024 peak, the stock corrected to below ₹2,300 levels. However, following massive FY2025 results, the stock regained momentum and created a new all-time high at ₹2,896. This establishes the ₹2,800-₹2,900 zone as a strong resistance area that has been tested multiple times.
Currently trading at ₹2,811, the stock is consolidating near the resistance zone. A decisive breakout above this supply zone with confirmation through bullish candlestick patterns would signal the next leg of the rally.
Entry Strategy: Wait for breakout above ₹2,900 zone with volume confirmation and bullish patterns.
🎯 Targets:
Target 1: ₹3,000
Target 2: ₹3,100
Target 3: ₹3,200
🚫 Stop Losses:
Minor Support: ₹2,600-₹2,700 (minor demand zone)
Major Support: ₹2,200-₹2,300 (strong demand zone)
If ₹2,200-₹2,300 zone is taken down, no more expectations on this stock.
💰 Q1 FY26 Financial Highlights (vs Q4 FY25 & Q1 FY25)
Total Income: ₹40,118 Cr (↓ -9% QoQ from ₹44,267 Cr; ↑ +16% YoY from ₹34,610 Cr)
Total Expenses: ₹31,296 Cr (↓ -12% QoQ from ₹35,517 Cr; ↑ +12% YoY from ₹27,927 Cr)
Operating Profit: ₹8,822 Cr (↑ +1% QoQ from ₹8,750 Cr; ↑ +32% YoY from ₹6,682 Cr)
Profit Before Tax: ₹3,834 Cr (↓ -4% QoQ from ₹3,996 Cr; ↑ +42% YoY from ₹2,691 Cr)
Profit After Tax: ₹2,767 Cr (↓ -7% QoQ from ₹2,973 Cr; ↑ +34% YoY from ₹2,066 Cr)
Diluted EPS: ₹20.85 (↓ -5% QoQ from ₹21.98; ↑ +28% YoY from ₹16.33)
🧠 Fundamental Highlights
Grasim Industries delivered robust Q1 FY26 performance with consolidated revenue rising 16% YoY to ₹40,118 crore, EBITDA growing 36%, and PAT climbing 32%. The company crossed the significant ₹1.5 lakh crore TTM milestone with standalone revenue surging 34% YoY to all-time high of ₹9,223 crore.
Market cap stands at ₹1,91,225 crore (up 2.37% in 1 year) with promoter holding at 43.1%. Stock reached all-time high of ₹2,896.55 before current consolidation, demonstrating strong momentum.
Key growth drivers include diversified business portfolio spanning Cellulosic Fibre, Chemicals, Cement, and new ventures. Birla Opus paints brand targets ₹10,000 crore gross revenue within 3 years, positioning to become the second-biggest player in the ₹80,000 crore decorative paints market.
Cellulosic Staple Fibre revenue grew 7% YoY with domestic volumes higher by 2% YoY, while Chemicals EBITDA surged 36% YoY. The strong performance across segments validates the diversification strategy.
Strong subsidiary performance from UltraTech Cement and Aditya Birla Capital continues to drive consolidated growth, with management expressing confidence in sustained momentum across all business verticals.
✅ Conclusion
Grasim's remarkable 25-year journey from sub-₹20 levels to ₹2,896 all-time high, backed by strong Q1 FY26 fundamentals showing 32% PAT growth and ₹1.5 lakh crore TTM milestone, validates the long-term growth thesis. The ₹10,000 crore Birla Opus paints target and diversified portfolio provide multiple growth engines. Breakout above ₹2,900 resistance could trigger the next rally toward ₹3,200 levels. Key support zones at ₹2,600-₹2,700 and ₹2,200-₹2,300 provide risk management levels.

Grasim A strong bullish trend is Showing on the daily chart.
Trade on 1 day time frame with strong buy signals in technical indicators and head shoulder chart pattern.
Watch for a breakout above 2850 to sustain the bullish trend. If the resistance holds, there could be a retest towards 2750 , 2700 and an uptrend from here.
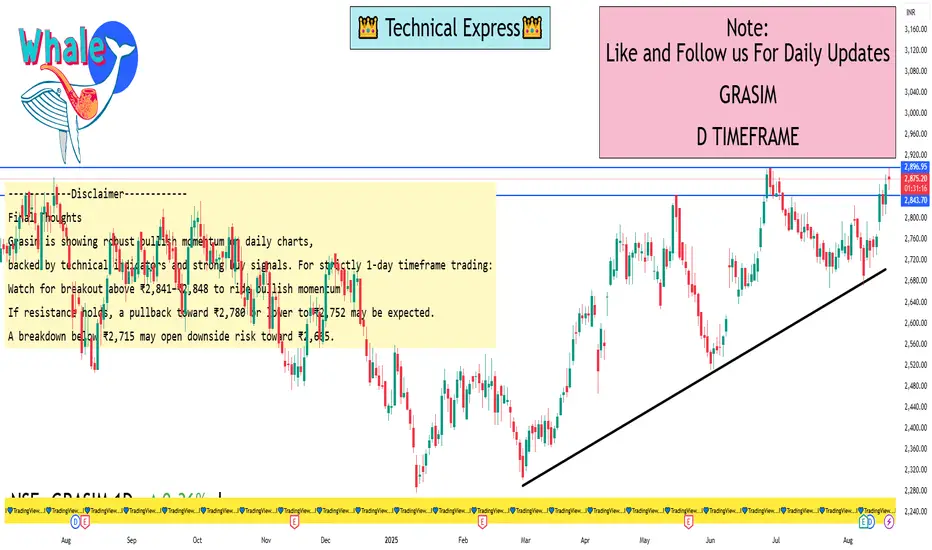
Grasim Industries LTD 1 Day ViewLatest insights from technical data providers:
Investing.com India indicates the daily technical recommendation for Grasim is Strong Buy. All daily moving averages (MA5, MA10, MA20, MA50, MA100, MA200) are signaling Buy, and technical indicators (RSI, MACD, etc.) align with a bullish outlook.
Munafasutra (NSE/MA platform) provides more specific levels for intraday trading:
Daily Resistance: ₹2,841.15
Short-term Resistance: ₹2,785.08
Short-term Support: ₹2,752.21
EquityPandit (weekly outlook, still helpful for context):
Immediate daily-level support: ₹2,715.00
Immediate resistance: ₹2,804.90
Primary weekly support: ₹2,665.10
Primary weekly resistance: ₹2,844.90
TopStockResearch gives technical overlays:
SuperTrend: ₹2,848.16 (indicates Mild Bearish on intraday basis)
Parabolic SAR: ₹2,672.60 (Mild Bullish signal)
Daily trading range: Low ₹2,807.40 to High ₹2,883.60
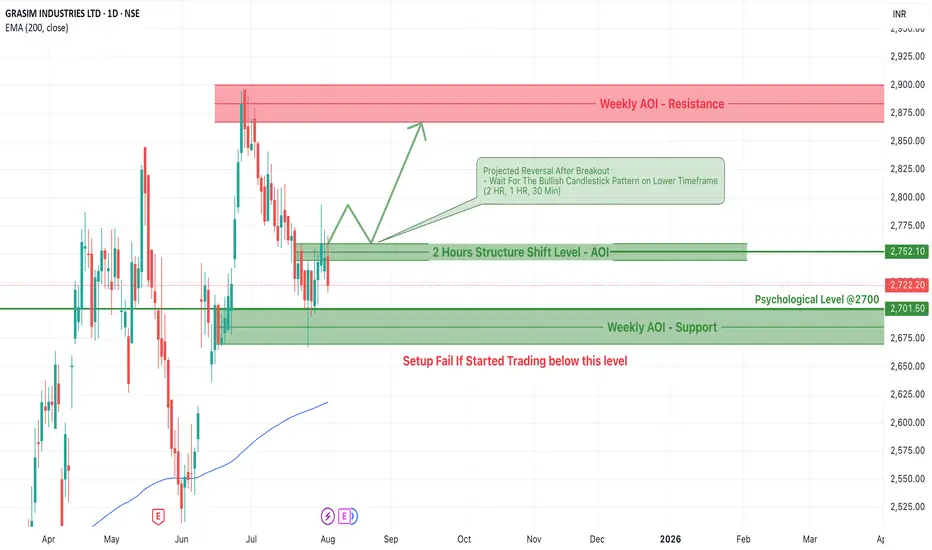
GRASIM Bullish Setup: Key AOI Levels and Reversal Trade PlanGRASIM Industries Ltd is currently forming a potential bullish reversal structure as it approaches a key structural AOI (Area of Interest) zone on the daily chart. This post outlines the complete trade setup, including price action analysis, important zones to monitor, trade plan, and conditions under which the setup could fail.
Key Observations
1. Weekly AOI – Support Zone
Range: Around ₹2,675 to ₹2,701
This green zone represents a strong weekly demand area, acting as a base for potential reversal.
Aligned with the psychological level of ₹2,700, this zone has historically acted as a strong pivot.
2. 2H Structure Shift AOI Zone
Level: ₹2,752.10
This level marks the intraday structure breakout zone on the 2-hour chart.
A successful breakout followed by a retest and bullish candlestick pattern may trigger confirmation for a long position.
Suggested lower timeframes for confirmation: 2HR, 1HR, and 30 Min.
3. Weekly AOI – Resistance Zone
Range: ₹2,875 to ₹2,925
The upside potential is capped at this resistance area, making it an ideal zone for partial or full profit booking.
Trade Plan Breakdown
Projected Move:
Price is currently hovering below the intraday structure shift.
If the price breaks above the ₹2,752 level, traders should wait for a pullback and confirmation in the form of a bullish candle on lower timeframes.
Post-confirmation, an upward move toward the weekly resistance zone is projected.
Entry Strategy
Trigger: Break and retest of the ₹2,752.10 level.
Confirmation: Bullish candlestick pattern (Pin Bar, Engulfing, or Morning Star) on 30 Min – 2HR timeframe.
Stop-Loss: Below the structure AOI or below ₹2,700.
Target 1: ₹2,875 (Near top of Weekly AOI – Resistance)
Target 2: ₹2,900+ (Aggressive target within resistance zone)
Setup Invalidation Level
If the price starts trading below ₹2,700, especially with strong bearish momentum, the setup fails.
In that case, price may revisit lower zones, and traders should refrain from taking long positions.
Technical Confluence
EMA 200 Support: Current price is significantly above the EMA 200 (₹2,618), indicating long-term bullish momentum.
Psychological Level ₹2700: Key psychological round number acting as a magnet and support.
Intraday structure shift: The break of lower timeframe structure adds strength to the setup
Risk Management Guidelines
Position Sizing: Do not risk more than 1-2% of capital per trade.
Wait for Confirmation: Avoid premature entries without bullish candlestick confirmation.
Trail Your Stop-Loss: After price moves into profit zone, trail SL to protect capital.
GRASIM Industries is showing signs of potential reversal and strength near the ₹2,700 zone. The structure shift on the 2-hour chart provides a bullish opportunity, but entry must be cautious and confirmation-based. With a solid risk-to-reward ratio, this could be a textbook breakout-retest trade if conditions align.
Buy Grasim Industries
Grasim Industries had completed first motive/impulse wave after the Sep-March correction.
After the 5-wave motive structure, the stock has been undergoing correction in the form of a zigzag, which is a 5-3-5 structure (marked conventionally as ABC).
The chart has all the wave markings.
The stock is likely to complete correction 'shortly' (end of wave C, i.e. third wave of the zigzag).
Buy on completion of correction.
Happy Trading.

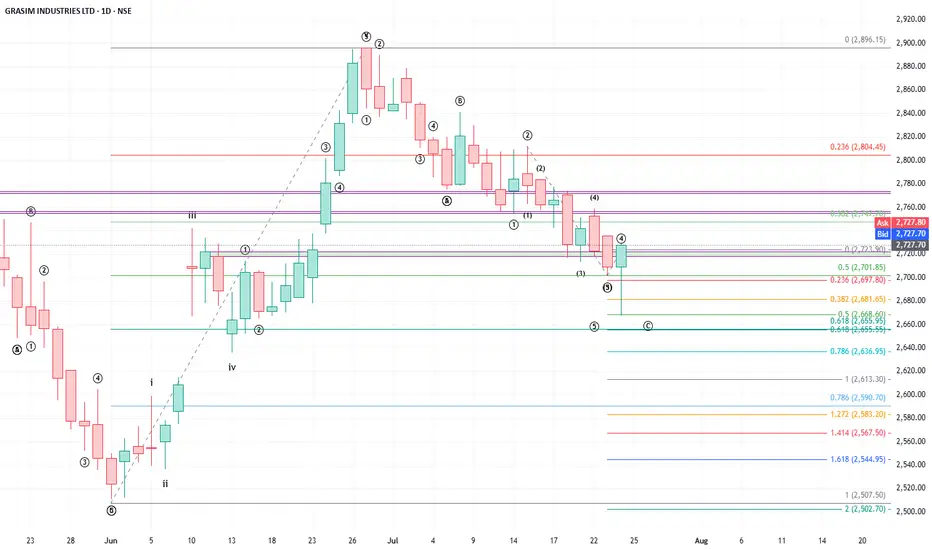
Buy Grasim
Further to my earlier buy call on Grasim given on 30 May, the stock delivered a return of over 15%. The stock completed its next impulse wave and has been undergoing correction since 27 June.
The correction happened in the form of a zigzag which is a 5-3-5 structure. All the wave markings are given in the chart.
The stock in all likelihood has completed correction at 0.5 fibo extension of wave 2-3 to 4 of wave as given shown in the chart.
Buy with a stop loss of 2647.
Target the last high and higher targets will be updated as the wave unfolds.
Happy Trading !!
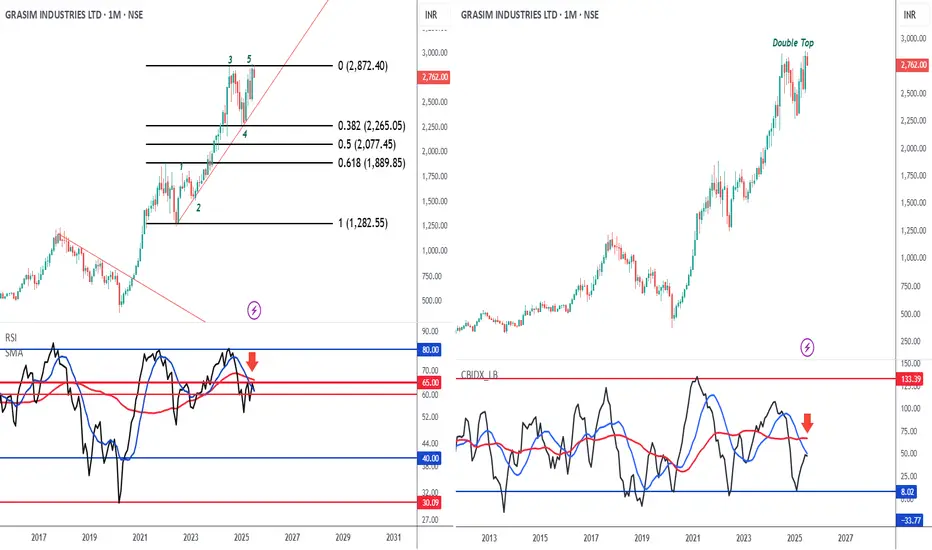
Watch out!! Its Double Top formation Grasim CMP 2762
Elliott - Here the 5th wave could not go past the 3rd wave and that's extremely negative. In common parlance its a double top.
Double Top - Its a directional signal and should be acted upon. The mid point of the same is at 2265.
Fibs - Once the mid point at 2265 is broken we should see both the zones at 2077 and 1889.
Oscillators - both the oscillators are below their MA cross is again danger. Since they are on higher time frame charts one needs to be extremely careful.
Conclusion - book profits.
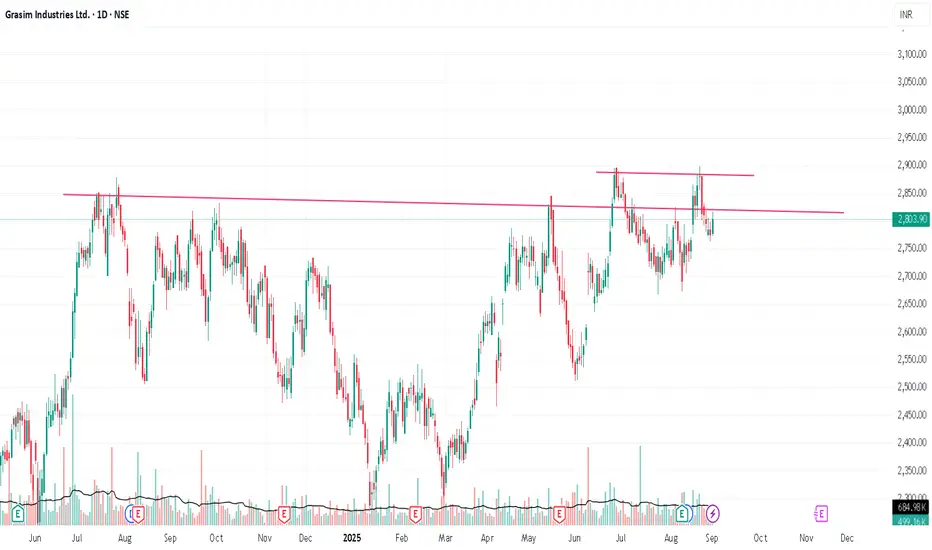
Grasim Industries Ltd. (GRASIM)🔍 Chart Pattern Overview:
📌 Multiple Top Resistance Breakout Attempt:
The chart shows a major horizontal resistance zone around ₹2840–₹2860, which was tested multiple times (July, September 2024, and now in June 2025).
Price has approached this level again and slightly breached, but currently struggling to hold above it.
🧭 Key Technical Observations:
Historical Resistance Zone:
₹2840–₹2860 zone acted as a strong supply zone.
Price got rejected from this level twice previously.
This current attempt is a crucial breakout test.
Trend & EMA Support:
Price is trading above all EMAs (10, 50, and 200), indicating a strong bullish structure.
10 EMA at ₹2786 is acting as immediate dynamic support.
Volume Action:
Volume is not significantly higher yet, which suggests caution — a confirmed breakout will require stronger volume participation.
🔄 Possible Scenarios:
✅ Bullish Case:
If price sustains above ₹2860 with strong volume, it could trigger a breakout rally.
Upside potential: Could rally towards ₹3000+ as there’s no historical resistance above.
⚠️ Bearish/Neutral Case:
If price fails to sustain above ₹2860, it may retest support near ₹2780–₹2750.
A breakdown below EMA could trigger short-term correction.
✅ Conclusion:
Pattern: Resistance retest (possible breakout pending confirmation).
Trend: Bullish above EMAs, but watch price action around ₹2860.
Breakout Confirmation: Needs strong close above ₹2860 with volume.
Support Levels: ₹2786 (10 EMA), ₹2750.

Breakout from cup and handle pattern Grasim Cup and Handle Breakout Setup
Grasim is forming a classic Cup and Handle pattern on the daily chart.
✅ Breakout Level: 2790
🛑 Stoploss: Below 2650 (handle low)
🎯 Target Zone: 3290 (based on depth projection and prior highs)
Pattern Logic:
Rounded cup base indicates accumulation
Handle pullback was shallow with declining volume
Breakout attempt with volume surge
Price above 20 EMA & 50 EMA
RSI > 55 and MACD nearing bullish crossover
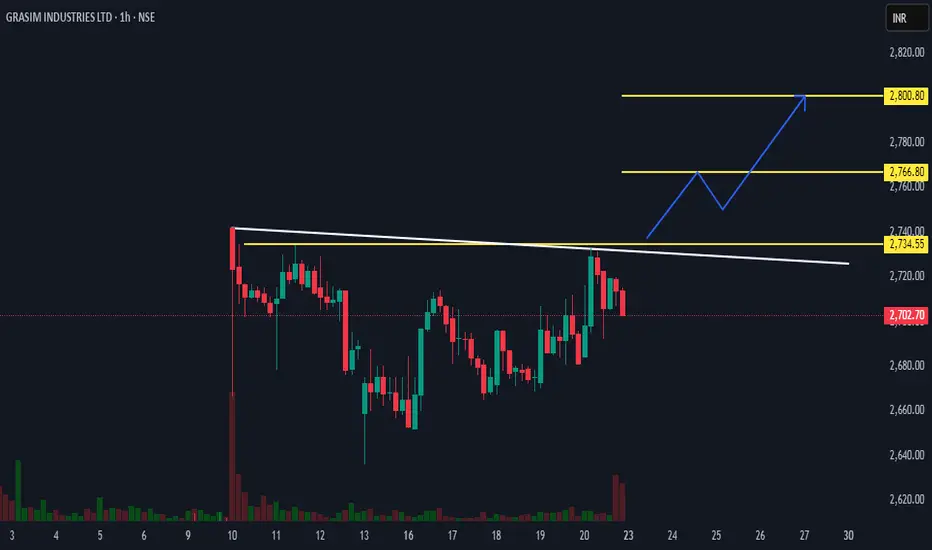
GRASIM 1HRSWING TRADE
- EARN WITH ME DAILY 10K-20K –
GRASIM Looking good for upside..
When it break level 2734 and sustain.. it will go upside...
BUY@ 2734
Target
1st 2766
2nd 2800
FNO
GRASIM JUN FUT – LOT 8 (Qty-2000)
GRASIM JUN 2720 CE – LOT 8 (Qty-2000)
Enjoy trading traders.. Keep add this STOCK in your watch list..
Big Investor are welcome to join the ride ..
Like this Post??? Hit like button..!!!
Follow me for FREE Educational Post and Alert..
Grasim Breakdown .. ExitGrasim 2663 has breakdown from support. Target 2500.
Bear volume supports Price result while Bull volume not.
On Valuation Grasim is overvalued . Currently trading at 48 P/E . It's fair Value of average 30 P/E it is valued for 1700. We expect Grasim will moved down to 2500

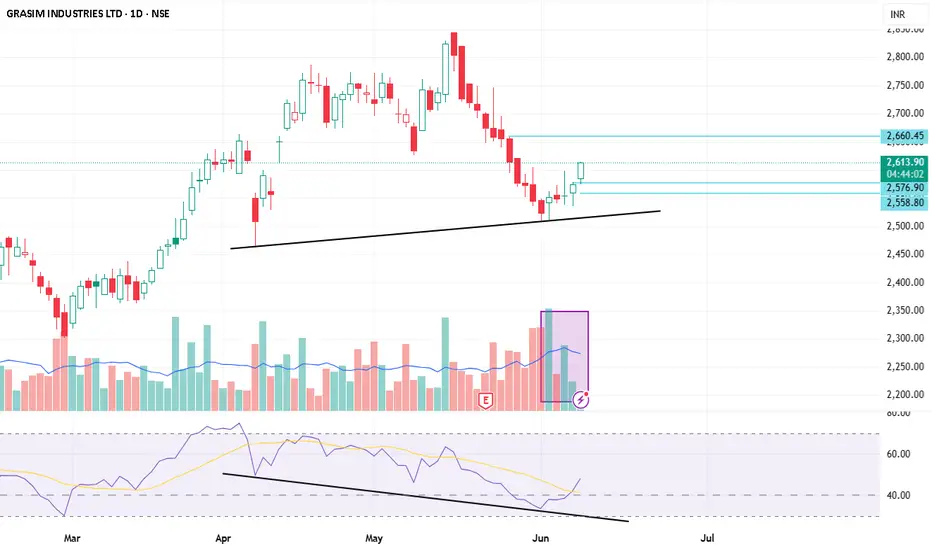
Grasim RSI Divergence observedRSI divergence observed on Grasim Stock with good volume. Add to watchlist and observe for the net movements.
GRASIM, DAIlY HI everyone,
I think Grasim should bounce until that retracement zone and if everything goes well. ATH very soon.
#grasim #Nifty50, #indiastockmarket

Grasim is fitting Harmonics for 2800Grasim seem to have taken support at previous reversal zone. As per the pattern it can touch 2700,2740, 2800 respectively.

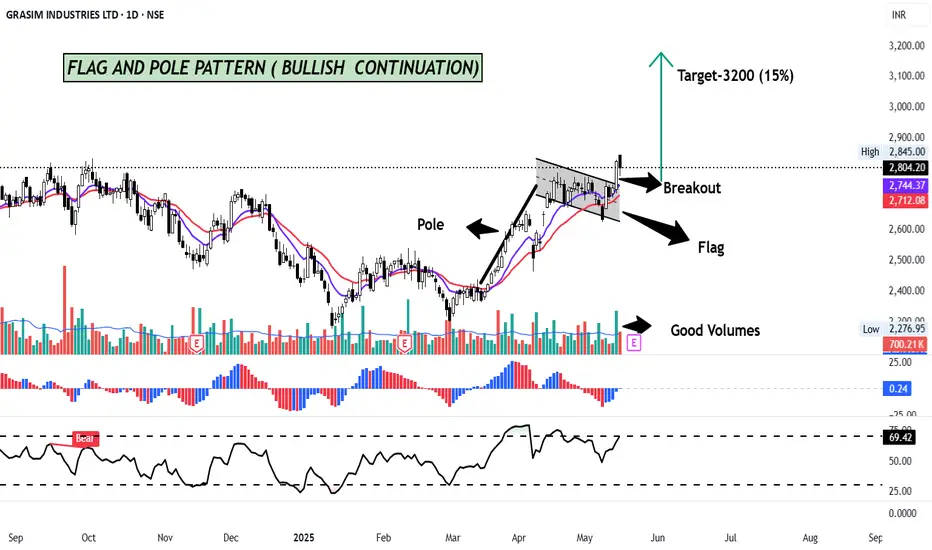
GRASIM- FLAG AND POLE PATTERN BREAKOUT ( BULLISH)GRASIM has formed a FLAG AND POLE pattern on the Daily charts and has given a breakout with good volume.
The "flag and pole pattern" in technical analysis is a chart pattern that signals a potential continuation of an existing trend. It's characterized by a sharp, initial price movement (the "pole") followed by a period of consolidation (the "flag") within a defined range. A breakout from this range, in the same direction as the initial pole, suggests a likely continuation of the original trend
The target of this pattern signals an upside potential of 15% from the current price level in medium term.
Stock is trading above its 11 & 22 day EMA. RSI is at 69, signalling positive momentum.
CMP- Rs. 2804
Target Price- Rs 3200 ( 15% upside)
SL - 2704
Disclaimer: This is not a buy/sell recommendation. For educational purpose only. Kindly consult your financial advisor before entering a trade.
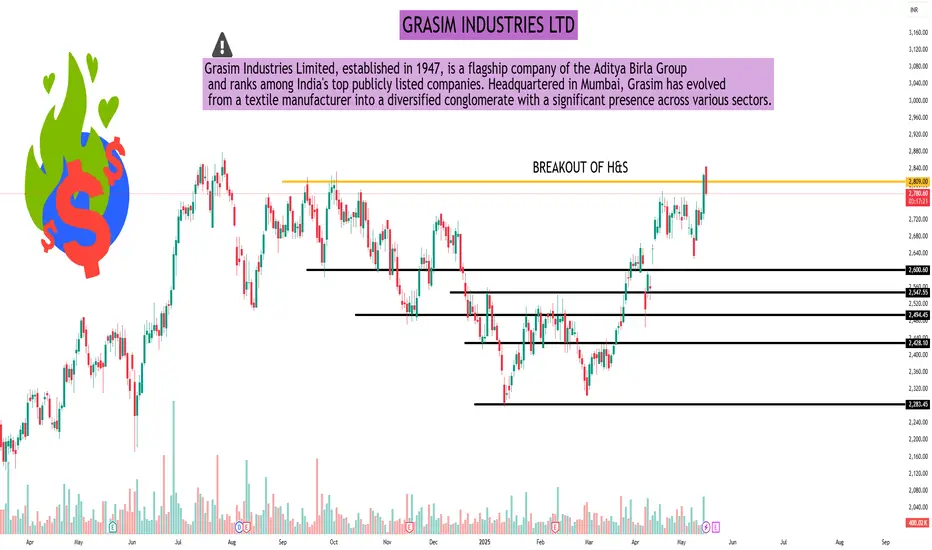
GRASIM INDUSTRIES LTDGRASIM INDUSTRIES LTD
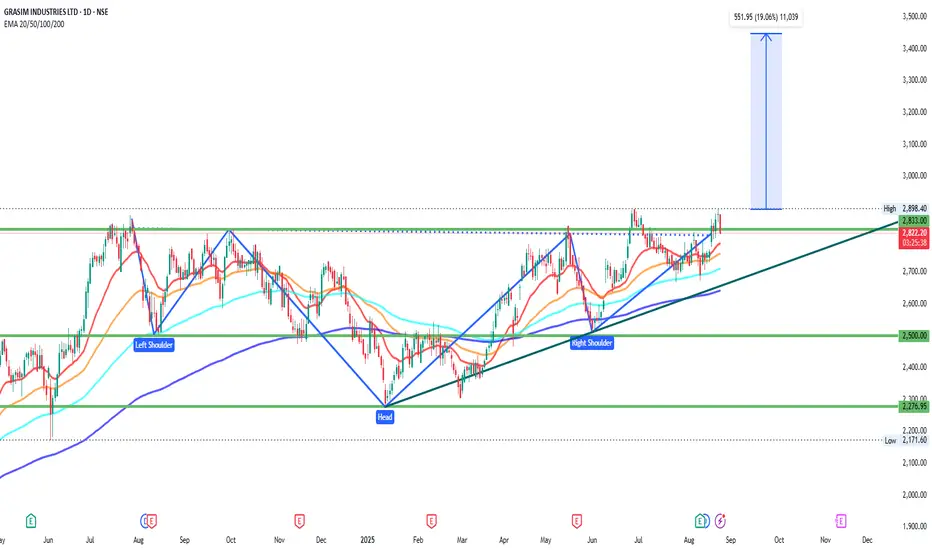
Grasim - Inverted Head and Shoulder Breakout
Grasim, posted strong numbers!
A nice Inverted H&S pattern breakout done.
Buy @ 2825-2800
SL 2630
Target: 3250++
RSI is above 60+
MACD is Positive and giving a cross over
along with DMI showing Strength
Stocks looks super strong!
Grasim - Inverted Head and Shoulder Breakout Grasim, posted strong numbers !
A nice Inverted H&S pattern breakout done.
Buy @ 2825-2800
SL 2630
Target : 3250++
RSI is above 60+
MACD is Positive and giving a cross over
along with DMI showing Strength
Stocks looks super strong!

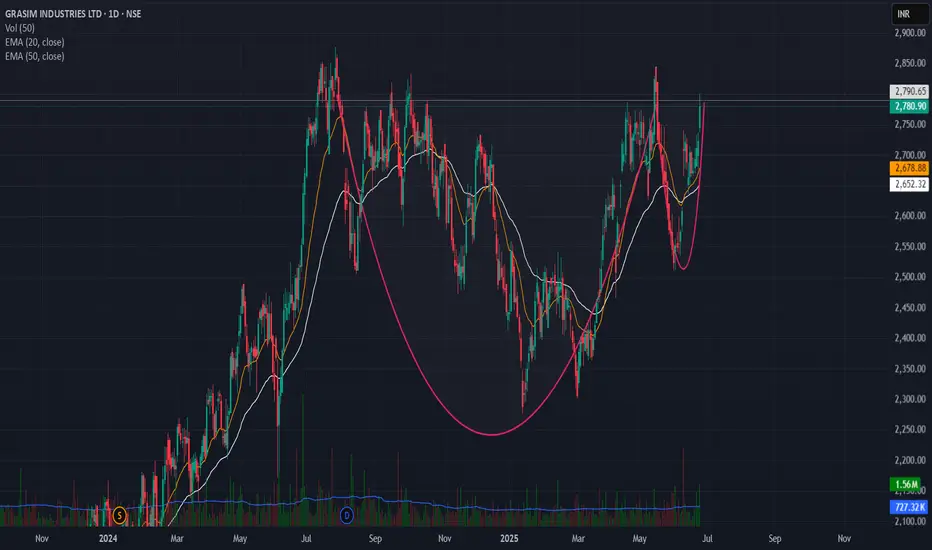
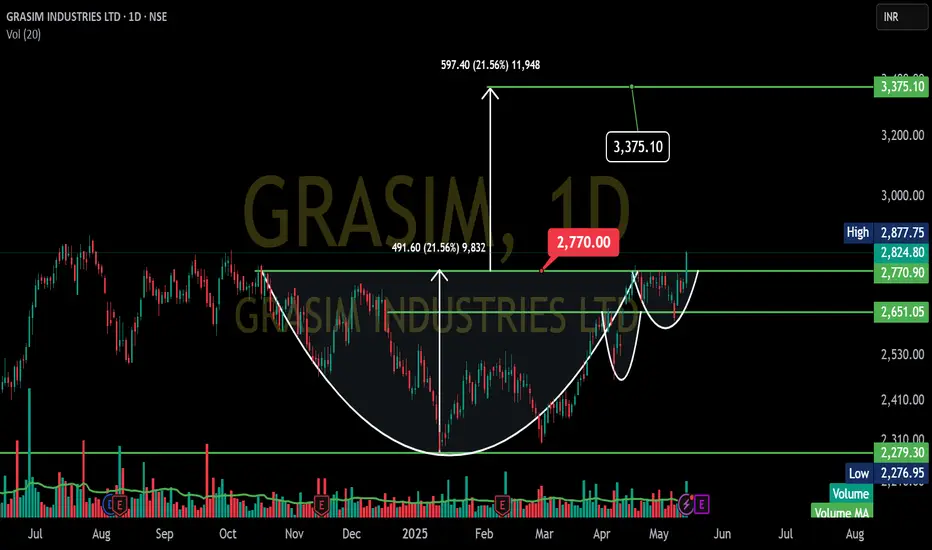
GRASIM - Daily- Cup and Handle- BreakoutGRASIM INDUSTRIES LTD chart.
Forming a cup and handle pattern, which is generally a bullish signal.
Here's a simplified breakdown:
Cup: Notice the rounded bottom shape that formed roughly between November 2024 and April 2025. This suggests the price found support after a decline and started to move upwards again.
Handle (Potential): After reaching a high around ₹2,770, the price has pulled back a bit. This dip could be forming the "handle" of the pattern. Ideally, this handle should be a smaller downward or sideways movement.
Breakout Level: The horizontal line you've drawn around ₹2,770 acts as a resistance level. If the price breaks above this level with good volume, it could signal that the cup and handle pattern is complete and the price might move higher.
Target: Potential target around ₹3,375.10. This target is often estimated by measuring the depth of the cup and adding it to the breakout level.
GRASIM - Daily chartGRASIM - Details in the chart explain everything, minute things are mentioned
If you like my analysis, please follow me as a token of appreciation :)
in.tradingview.com/u/SatpalS/
For learning and educational purposes only, not trading advice. Please consult your financial advisor before investing.
