GrasimBreaking out of consolidation.. if it sustains with todays close then can be looked for long side
GRASIM trade ideas

GrasimRectangle breakout and trend breakout awaited.. once broken with good volumes then will check for longs


Grasims inverted head and shoulder pattern on 1 hour chartGrasims - inverted head and shoulder pattern on 1 hour chart
Can be a long for short term with a candle close above 1370

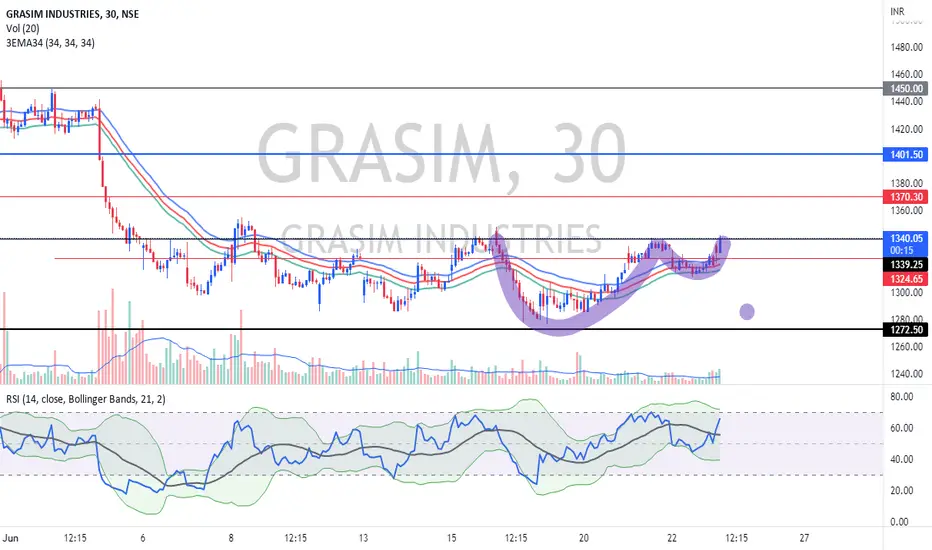
CUP AND HANDLE PATTERNGrasim has formed cup and handle formation on 30 mnts chart so buying could be done above 1340 for the stop of 1310 levels to the tgt of 1370 and for positional players stop goes for 1280 and tgt is 1400 levels
LONF ON GRASIMNSE:GRASIM
I t is short term trade
The stock is at daily support zone
It can show 1500 in near future . As its near resistance is at that price
This is for educational purpose .

Grasim - A swing Trading OpportunityChart Published is giving us a good look at the potential buying opportunity as it is testing weekly previous resistance zones as support.
In Weekly charts it is testing the same levels which used to be resistance once and now acting as support.
Price is holding these levels and making a range.
But remember until it closes above the consolidation zone no entry is to be taken as price might break down too.
Why we should buy at these levels?
Ans is simple risk to reward is good.
2 Targets has been plotted for the reference.
Keep an eye.
Fingers crossed & Happy Trading.
Thanks & Regards
Saurabh from Learner's Paradise.

#GRASIM ready for Breakdown , expected tgt @1290#GRASIM ready for Breakdown
chart structure very weak
expected tgt @1290

GrasimTrading at deemand zone long term investers can consider this opportunity to accumulate
Always follow Risk and Position Management❇️❇️
For more information like this follow me in Tradingview @Jagadeesh11616125
Happy trading😊

Grasim Chart Analysis !!📈 Grasim Industries 📉
This Stock Broke out from a resistance zone of 1600-1630 which was acting as a support also Oct, Nov and Dec 2021 and today managed to close above it.
Bias - Long
Target - 1778, 1920
SL - 1556
RR- 1 : 2.5
All Important Supports and Resistances are drawn in chart. All levels are on closing basis.
Please have a look and revert back if you need some more study on it.
Disclaimer : Consult Your Financial Advisor Before Taking Any Decision On This Analysis.


GrasimGrasim 1692
Below 1685,
I am expecting Grasim to move towards south
It would be positive if it sustains above 1725 levels
Chart is for study levels

GRASIM.Buy GRASIM INDUSTRIES above 1790. BIG BODY candle is formed which indicates positive movement in stock.

Grasim at Fib Support + Demand zoneNSE:GRASIM at 38% fibonacci support + inverted head and shoulder + RSI ABOVE 50. All tgts, SL buying zone given in chart.

Swing tradeBuy at current price level with SL any candle close below current candle and momentum data for upside with volume supported targets 1900 & 2100

Rising Wedge Pattern in-formationRising wedge patten seen at 1hr TF and also Double top patter formed at 15min TF which will indicates great short entry in Grasim

Grasim aarea to look for for intrday Grasim key zones for intrday ... watch PA near the zones and take a call as per the PA ..

Grasim Trade With Help Of IchimokuGrasim Trade With Help Of Ichimoku , weekly chart for long term investment ,100 % return.

Look At last candle volume of GrasimThat volume is very much talk about what next is. hence , we also have confrmation about price action.

16th March 2022 Nifty, BankNifty, Bata, Grasim ReviewNifty: 17050 is Key level breakout and sustain is must for more upside weekly cls above 17200-250 this can open doors for 17750-800 also.
Banknifty: 35900-36000 is key level, breakout and sustain is must for more upside. weekly cls above 36200-250 this can open doors for 37200-37500.
Bata: if is able to sustain todays closing on weekly basis, can test 2030-2070-2100 in coming days.
Grasim is as at crucial level. breakout above 1625-30 can open doors for more upside.
DO like share and comment
Disclaimer: I am not a SEBI register analyst.
These views and study is my own for educational purpose only and not any trade recommendation.
Not responsible for any profit/loss.

Grasim facing resistance.Grasim is just near a weekly time frame resistance zone.
Short the stock, if the price break down below 1540.
Support :- 1541, 1500-05
Resistance zone:- 1572-1597
On daily closing basis the price has closed near the resistance zone.
Wait, watch and trade.

Grasim IndustriesNSE:GRASIM
The chart of Grasim Industries is weak as the breakdown has come from a double top pattern. At present, the stock is trading near an important support level. If the same is broken, the stock can fall up to 1242-1278 level.
