GRASIM, Inside Candle + Support Breakdown FormationGRASIM broke mid term support line last week and for past 3 days it has been consolidating.
If this break 1540 (1530 for safe traders), then there is possibility of down move.
Along with support breakdown, this also has inside candle formation.
Should be avoided in case of gap down below 1535.
Thanks
Piyush Gupta
GRASIM trade ideas

GRASIM Trade setup part 2Similar degree wave 1 formation nearly Completed. Now wave 3 of a (5) has kick -off .we confirm this Rally with higher volume in this stock next few days....

Long Term short position in GRASIMEducational purpose only : Wave 5 has terminated here wave (1)= wave (5)
Truncation wave( 5 ),Wave ((5))= 0.681 * wave ((3)). Both level are co incidents in same price level .
.Motive cycle was completed.
Now started Correction in higher degree. ABC formation in coming weeks....
Try anyone with long term short position trade ... In grasim....


GRASIM FOR INTRADAY 22 FEB buy if level will break after 15 min candle closing both side level has been given

THIS IS CHART OF A GRASIMHELLO EVERYBODY
This chart is Grasim and I have created a combination in which the combination becomes the first FLAT second ZIGZAG the third triangle running.
thank you

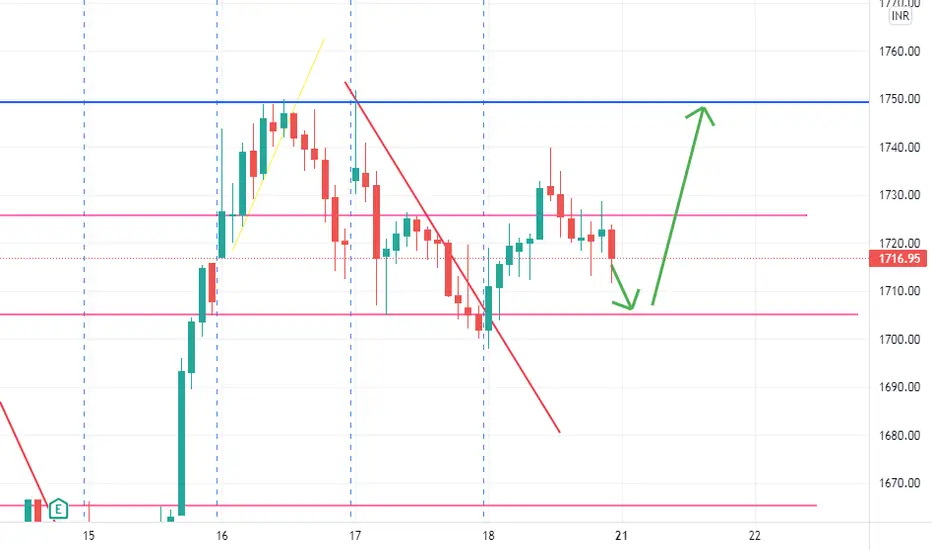
expecting Grasim to continue uptrend after a pullbackexpecting Grasim to continue uptrend after a small pullback

GRASIM [15min]for 01/02/22 may be open gap up tomorrow
if break resistance then bullish
if your agree my idea follow me
Disclosure : I am not SEBI registered. The information provided here is for Education Purposes only. Consult your financial advisor before taking any decisions

GRASIM INDUSTRIES MID-TERM SWING TRADE!Hi everyone, Grasim industries mid term swing trade consider buy above: 1,790, targets: 1,894/1,965/2,080, stoploss: 1,722.
LOGIC BEHIND TRADE: Stock on daily chart has formed (W) pattern & near it`s resistance if breaks next resistance will be all time high above (ATH) on weekly chart (harmonic xabcd pattern level 1.618) will be activate & target will be 2,080. Stoploss is taken low of resistance candle. NSE:GRASIM

GRASIMHello Everyone,
This chart is made by Triangle,so now wait and watch
thanks,
Anjali_Chitroda
Learn & Earn


GRASIM For Swing and Intraday Trade on 07 Feb 2022Good for Intraday 07 Feb 2022 and Swing as Well. For intraday it is making a bullish flag pattern so we can look for long move depending upon the market trend and for Swing the Script has retraced from FIB Level.

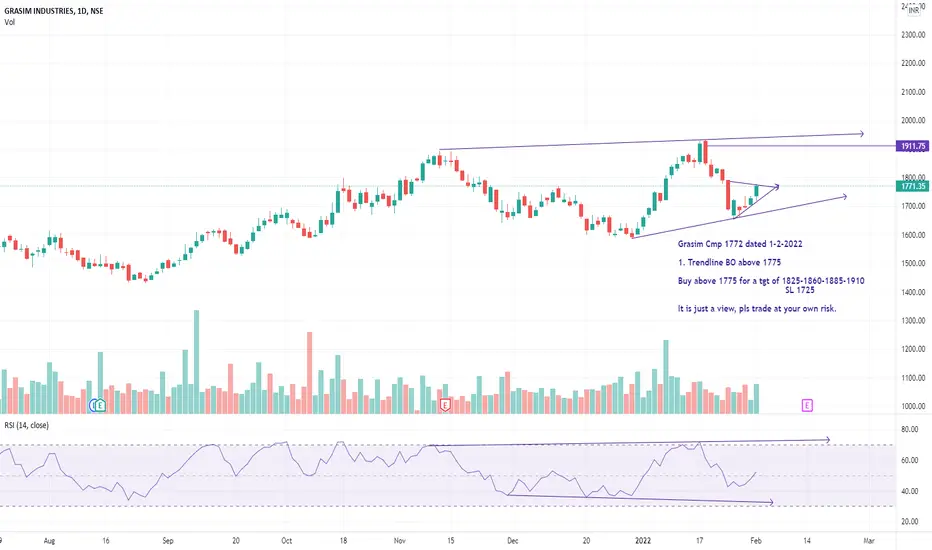
Grasim Cmp 1772 dated 1-2-2022Grasim Cmp 1772 dated 1-2-2022
1. Trendline BO above 1775
Buy above 1775 for a tgt of 1825-1860-1885-1910
SL 1725
It is just a view, pls trade at your own risk.
Grasim Lons SetupWe are expecting the price to reach 1880 which can be a potential resistance level for stock, while on the downside support is at 1700. We can build a trade at CMP with a stoploss at 1700 and 1880 as target.

NOT AN EXCITING STOCK - GRASIM It can give decent growth. Small exposure to portfolio is good, not any major swing expected
BUY ABOVE 1835
STOPLOSS AT 1655
TARGET FOR 2005

GRASIM LOOKING FOR REVERSALon houly chart Grasim forming W pattern which is trend reversal pattern , volume also expanded buy at cmp sl will be 1662

Tringle pattern breakout in GRASIM . when to enter .As you can clearly see grasim gave a tringle pattern break out in daily chart . Now what further moves can be . According to me when these types of breakout comes market take a regression in upcoming candles . So on monday I will be waiting till 11:00 AM and than if market will be bearish I will not enter . But if market will be bullish i will take a swing position .
also check macd and rsi are strong .
And yu can see my targets on chart .
This is mine own analisys do yours as well its my opinion and should not be taken as tip.

[ INTRADAY ] GRASIM LONG BETrisk: Reward ratio is 1: 2
Rest as per Charts
********
Note -
One of the best forms of Price Action is to not try to predict at all. Instead of that, ACT on the price. So, this chart tells “where” to act in “what direction. Unless it triggers, like, let’s say the candle doesn’t break the level which says “Buy/Sell if it breaks”, You should not buy/sell at all.
=======
I use shorthands for my trades.
“Positional” - means You can carry these positions and I do not see sharp volatility ahead.
“Intraday” -means You must close this position at any cost by the end of the day.
=======
Always follow a stop loss.
In the case of Intraday trades, it is mostly the “Low/High of the Candle”.
In the case of Positional trades, it is mostly the previous swings
********


Fresh Breakout in Grasim Good Opportunity for BuyingNSE:GRASIM
As whole market took a good correction , Grasim took a correction of
16% from its ATH. it took a trending resistance while coming down and
Broke it recently as well as gave breakout to the consolidation of past few
Days and seems very bullish and shoes a great opportunity for buying.
Addition to this CNXINFRA(NIFTY INFRA) has also gave a sectoral breakout .
as Grasim being its good member money inflow would start in it as well.
We can consider an entry on retracement or above the high of previous candle
for the given targets in the chart.
HAPPY INVESTING!!!
NOTE - THIS TRADE IDEA IS ONLY FOR EDUCATIONAL PURPOSE
WE ARE/WOULD NOT BE RESPONSILE FOR ANY PROFIT OR LOSS

Buy above 1932 SL 1900 TGT 1970 and 1993Suggestions are based on my analysis only. Please do your analysis before taking any trade.
