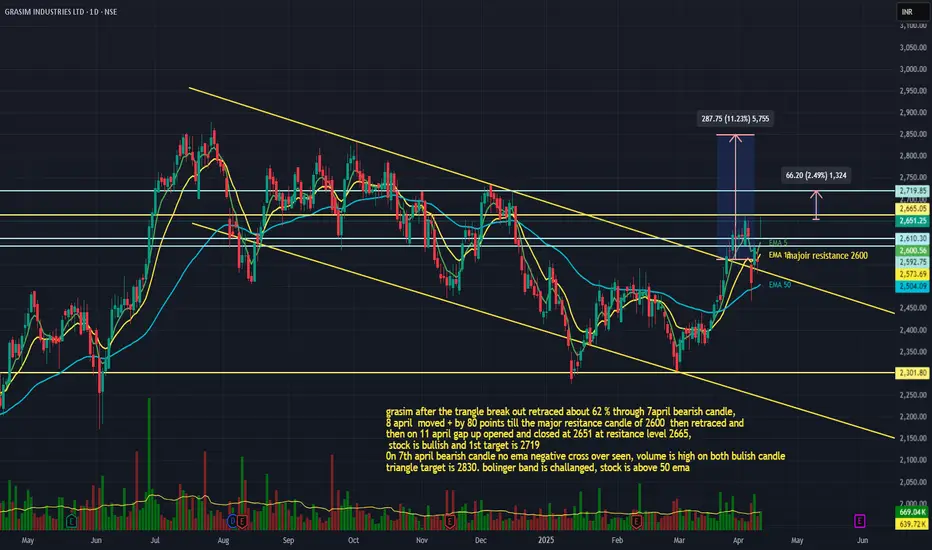
grasim after the channel break out Grasim after the tringle break out retraced about 62 % through 7april bearish candle,
8 April moved + by 80 points till the major resistance candle of 2600 then retraced and
then on 11 April gap up opened and closed at 2651 at resistance level 2665,
stock is bullish and 1st target is 2719
0n 7th April bearish candle no ema negative cross over seen, volume is high on both bullish candle
triangle target is 2830. Bollinger band is challenged, stock is above 50 ema
GRASIM trade ideas
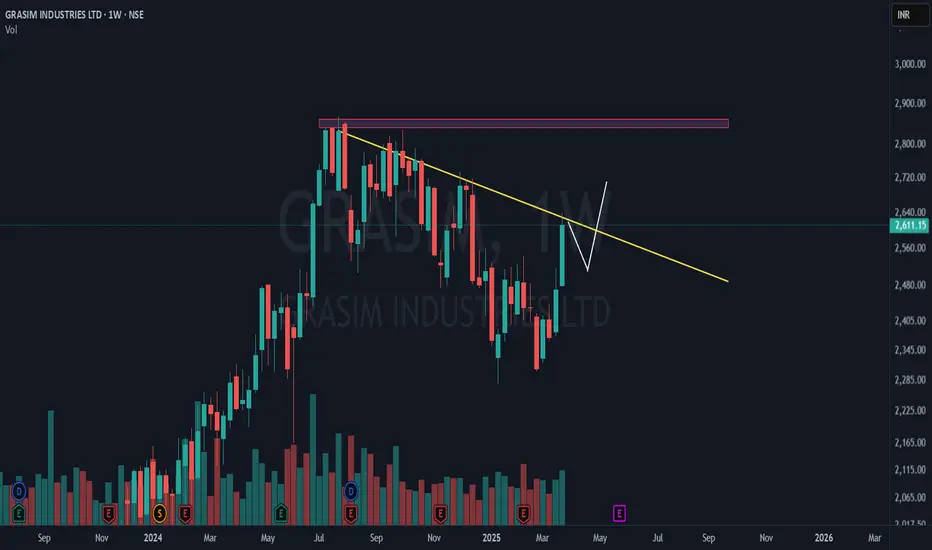
grasim industries ltd | breakout loading?📌 yellow counter trendline (ct) – A key resistance trendline on the weekly timeframe (wtf), which the stock is currently holding at. A breakout is pending .
📌 double bottom breakout – The stock has already rallied significantly after breaking out from a double bottom pattern. However, it's now in a crucial consolidation phase, needing a halt .
📌 price action roadmap – The current structure suggests either a consolidation or a minor dip, followed by a potential breakout above the yellow ct.
📌 red supply zone = major resistance – This area marks both the weekly timeframe all-time high (wtf ath) and multi-timeframe (mtf) resistance, making it a critical level to watch.
A clean breakout from here could be an "ice-break" move! 🚀 Will it break and fly or face rejection? 🤔
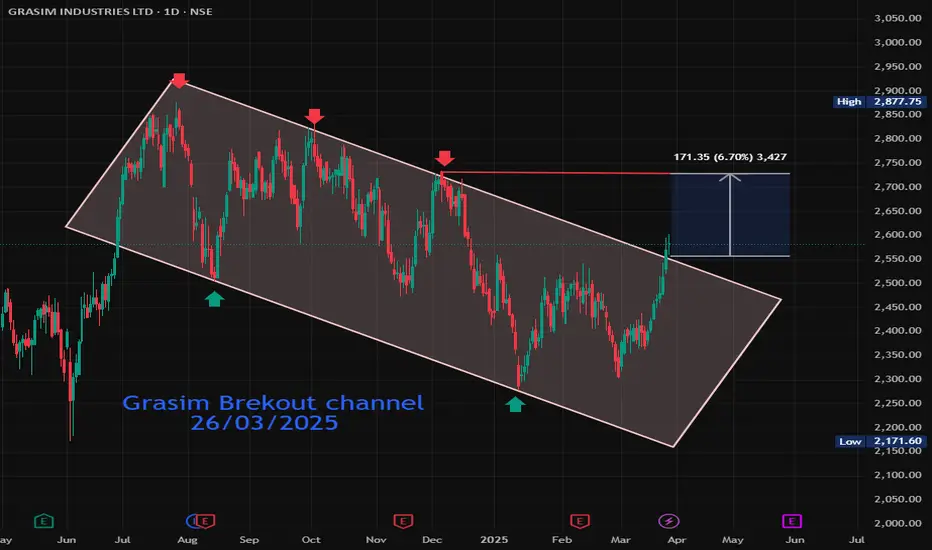
Grasim Brekout channel 26/03/2025NSE INDIA, Symbol : GRASIM Timeframe : Daily. GRASIM first channel top 2878 (HH) on dated 25/07/2024 Then 14/08/2024 (LL) First Bottom 2508.Second Bottom crated 13/01/2025 then two times GRASIM channel top respected Break out the channel top line 25/03/2025 and today sustained above the line. Grasim up move 6.7% no any resistance.
view on grasimGrasim
current price: 2487
resistance zone: 2550-2500
failing to break this resistance zone the stock might see 2400-2360-2300 but if it manages to cross above this resistance zone, we may see upside target of 2600-2700

Weekly out look i have made efforts in displaying my view as how i see this stock can perform in coming
Weeks
My analysis is based simple measured move method
if you have Questions please comment i will try to address it
Thanks

28/01/2025 Grasim Retest Resistance LineToday Grasim Retest Resistance Line Trend line and down closing . 26/12/2025 Grasim Brkdown the line. Today Retest that and down closing of line

A rally to exitGrasim CMP 2376
Fib- its at a strong fib and trendline support. It has turned just before the MA support. Hence, we know this zone is a strong support. At price support RSI is taking support above its bull zone. It should rally to 2500/2570.

GrasimPrice gave two side move today and in that process it has formed an ascending channel. And now price is at the channel support.
Buy above 2326 with the stop loss of 2306 for the targets 2348, 2372, 2394 and 2408.
Sell below 2285 with the stop loss of 2305 for the targets 2268, 2240, 2210 and 2192.
Do you own analysis before taking any trade.

Keep an Eye - Good to go above 2530Grasim Industries Ltd CMP - 2499 Looks good on Daily time frame. Uptrend then side ways consolidation for almost 6 Months , then Support breaks and remove Buyers . Looks good with 1:3 Risk to Reward.
Disclaimer :- Idea shared for information and education purposes only and should not be treated as investment or trading


Rounding bottom BO & Retest in GrasimIn the down turn Grasim had make a rounding bottom. It broke out and is currently at retest level. A bounce from here will take it much higher. Break down of horizontal trend line will negate the view.

GRASIM - UP for a 10% correction from 2500 levels?
CMP - 2508
TF: daily
5 wave impulse from June'22 lows (1271) has ended at 2877.75. The Zone for the 5th wave termination was between 2731 to 2923
Internal counts are highlighted/mentioned in the chart for easy understanding.
Upon completion of the 5 wave impulse, price came down in single leg about 380 points. We can consider this as wave A and then a corrective rise to 2833 for wave B and thereby making a Double TOP. Price is now trading in the C wave and could potentially head towards 2200-2100 levels in the coming sessions.
This fall could very well be a 5 wave structure too.. but for now, I have labelled it as 3 wave down-move only.
Break of the 2-4 trendline (rising trendline from wave 2 low of 1521 and wave 4 low of 2171) would confirm trend reversal
For now. the AVWAP from the B wave top at 2645 will act as the RESISTANCE
- Price has broken the swing low of 2505 and consolidating at the breakout zone. Needless to say, the first dip to this level was bought in to already.. the current consolidation could very well signify a potential breakdown.
- the 2490-2510 range is also happens to be the 200 DEMA.. Price is consolidating here instead of bouncing up strongly.
- Price on Daily TF is trading well below the Cloud, Base and Conversion lines..
- The next potential SUPPORTS are 2171 June'4th Low, and 2210 (AVWAP from the lows)
- Since this is a retracement of the entire impulse from 1271 to 2877, the 50% fib level is placed at 2075
- In harmonic pattern, the minimum expected target is around 2250
- Assuming that this is a 3 wave swing, I have considered alternate Shark pattern in Harmonics.. if it goes past the X leg at 2182, then Cypher pattern will come in to play (target would be 1900 to 1700).. to be reviewed how it acts at 2000-2200 levels first.
I am not a SEBI registered Analyst. Views are personal and for educational purpose only. Please consult your Financial Advisor for any investment decisions.

GRASIM Trading near Weekly Demand Zone of ₹2608 to ₹2505.05 GRASIM's current price is ₹2544.85, placing it near a weekly demand zone between ₹2608 and ₹2505.05. This zone, formed on August 23, 2024, could serve as a potential support level. Investors may want to monitor this area for signs of a price rebound or stability, suggesting possible opportunities for accumulation within this range.

GRASIM Trading near Demand Zone of ₹2534.50 to ₹2505.05GRASIM’s current price of ₹2562.70 positions it near a demand zone between ₹2534.50 and ₹2505.05. This zone, is formed as recently as August 16, 2024, may provide a support level, suggesting a potential for price rebound or stabilization within this range. Investors could watch for price reactions around this zone to evaluate entry opportunities based on further movement.

Grasim Industries Ltd Analysis for 14th OctoberRed levels represent selling zones.
Green levels represent buying zones.
Orange levels are important levels, which can act as either buying or selling points depending on the market's behavior.
If the market opens above the orange level, it will act as a buying level.
If the market opens below the orange level, it will act as a selling level.
Regarding the current market close (2,721.20), the closest orange level is not visible on the chart. However, based on your analysis, any movement around this area should be carefully watched for potential buying or selling reactions on the next trading day.
This analysis is for 14th October, provided in advance to help plan trades effectively.

#GRASIM Support & Resistance #GRASIM
Current Price: ₹2,678.25
Trend: Sideways (Consolidation Phase)
Chart Pattern: Rectangular Consolidation
(Range-Bound between ₹2,600-₹2,800)
Resistance Levels:
Immediate resistance: ₹2,750-₹2,800
Next resistance: ₹3,000
Support Level:
Immediate support: ₹2,600Strong support: ₹2,550 (stop loss level)
Volume: Moderate volume, with a decline during consolidation; significant volume
spike seen earlier in July during the uptrend. Recommendation: Buy near support level around ₹2,600 if it holds Place a stop loss at ₹2,550 to manage risk Target price range: ₹2,800-₹3,000 for short- to medium-term gains

Study of bull buying of grasim with SL of 90pointsOnly N positive patten who has break the last high...so bull view

Study of bull buying of grasim with SL of 90pointsOnly N positive patten who has break the last high...so bull view

Grasim Industries Ltd view for Intraday 12th SeptemberGrasim Industries Ltd view for Intraday 12th September #GRASIM
Buying may witness above 2700
Support area 2650. Below ignoring buying momentum for intraday
Selling may witness below 2650
Resistance area 2700Above ignoring selling momentum for intraday
Charts for Educational purposes only.
Please follow strict stop loss and risk reward if you follow the level.

Grasim potential breakout stockGrasim Industries Ltd. 🌟
Grasim Industries Ltd., a flagship company of the Aditya Birla Group, continues to shine in the diversified sector. As of today, the stock is trading at ₹2,757.551.
Key Highlights:
Market Cap: ₹1,83,922 Cr.
PE Ratio: 34.99
EPS (TTM): ₹77.23
Dividend Yield: 0.37%
52-Week High/Low: ₹2,877.75 / ₹1,827.52

Grasim Buy above 2668 and Target 2822.Grasim support taken 2668 and strong this level and Target for this support 2822.

Grasim Industries - Bullish Flag PatternLet's break down the analysis provided for Grasim Industries Ltd based on the bullish flag chart pattern, as outlined by Arvind Share Academy. This is for educational purposes, so here’s how you might evaluate and implement such a trade:
Trade Plan Breakdown
Current Market Price (CMP): ₹2700
Context: This is the price at which Grasim Industries Ltd is currently trading. Understanding the CMP helps to set up entry and exit points effectively.
Buy Above ₹2725
Entry Point: The suggestion to buy above ₹2725 indicates a breakout level where the stock price is expected to move higher if it surpasses this level. This price is above the consolidation phase (the flag) and is likely where the upward momentum should resume.
Purpose: This strategy aims to enter the trade only when the stock shows a confirmed breakout from the bullish flag pattern, reducing the risk of buying into a false breakout.
Stop Loss (SL) at ₹2640
Risk Management: The stop loss is set at ₹2640, which is below the flag pattern and recent consolidation lows. This level is crucial for limiting potential losses if the trade does not go as planned.
Rationale: Setting the stop loss at this level protects against significant downturns while allowing some room for price fluctuations.
Target 1: ₹2865
First Target: This level represents a near-term profit-taking point. It might be based on technical projections from previous resistance levels.
Strategy: It’s often wise to consider taking partial profits or reassessing the trade when the stock reaches this level, especially if it faces resistance.
Target 2: ₹3000
Extended Target: This target is set higher, assuming that the bullish momentum continues beyond the initial projection. This level reflects a more optimistic outcome and suggests further potential upside.
Strategy: As the stock approaches this level, monitoring its behavior is key. Adjusting stop losses or taking additional profits may be prudent if the stock shows signs of reversing.

Grasim swing trading simple ORB Strategy with volume ...I will buy near EOD If the price Trade above the blue line...after entering I will wait for the target or (SL) and if goes against my view which be CANDLE CLOSED below Red line in D candle i WILL CLOSE THE TRADE....CHECK THE TARGETS IN THE CHART
It's just my view educational purpose only I'm not SEBI registered
