GRASIM trade ideas

Grasim-Flag Pole Breakout - WatchGrasim :
Looks interesting, Flag Pole Breakout
Currently at Resistance
Need to sustain 1580 levels


GRASIM 1D Indicating Strong Demand1) Price consolidating for more than a month
2) Two recent pullback with 2nd pullback with higher low indicating stocks is in strong up move
Watch for upside breakout after consolidation (accumulation phase at top). If it breaks down (distribution phase) then wait for price to retrace back to any of the previous pullback level and then reversal.

Momentum Breakout -Grasim @ ATHGrasim made ATH today with a strong breakout. Looks good for swing traders at CMP.

GRASIM INDUSTRIED- INVERSE HEAD AND SHOULDERS BREAKOUTGRASIM INDUSTRIES HAS BREAKED OUT INVERSE HEAD & SHOULDERS PATTERN, CAN TAKE BUY ENTRY AROUND 1500-1510 LEVELS.
BUY TARGET- 1560 / BUY STOP LOSS- 1450


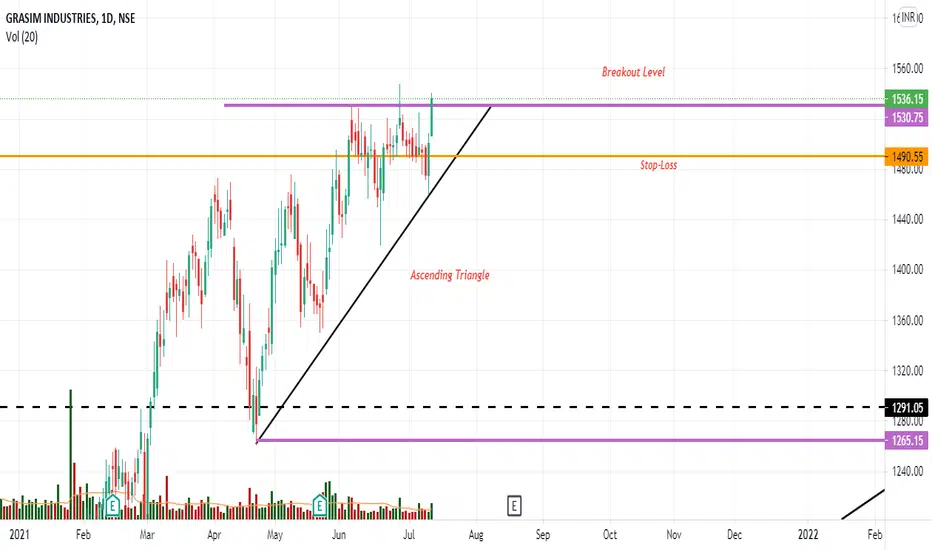
#GRASIM 1D TF Ascending Triangle Breakout for Swing Trade- Ascending Triangle pattern breakout with the promising volume on the breakout candle
- Stop-loss is placed at 3% of the prices below the breakout level
- Risk to Reward ratio is attractive
-Width of the triangle is projected as the target
- Scaling out can be followed
Swing Opportunity in GrasimGo Long above 1508.1 for Targets of 1555.2 and 1602.3 with SL 1461
Reasons to go Long :
1. Stock is taking support from the Trendline (marked with green color) and formed a bullish candlestick pattern Bullish Engulfing (marked with an orange circle).
2. Also stock is trading near a demand zone (marked with a purple rectangle).

GRASIM - Intraday - 1 Hour chart analysisGrasim can be traded intraday in coming sessions upon BO. if a 5/15 min candle closes above the TL.


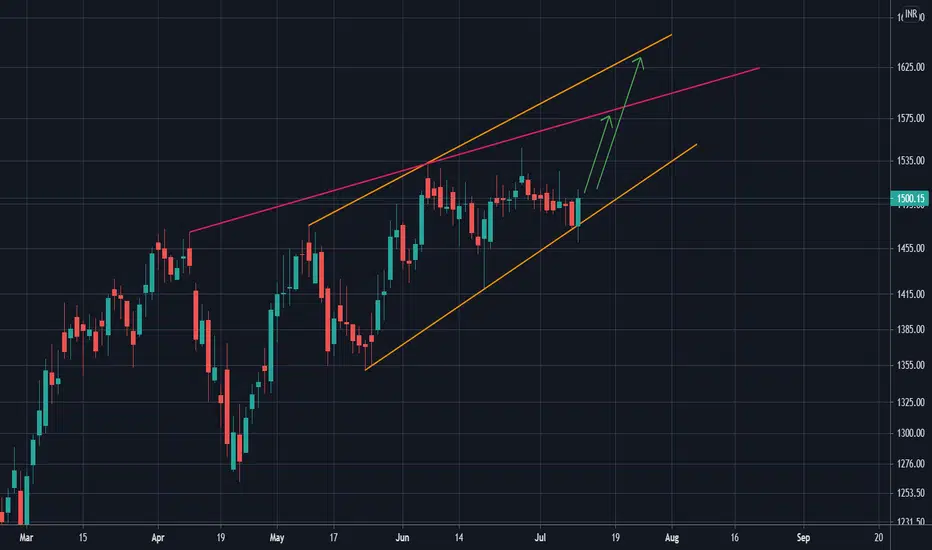
Grasim (Long)Gave a very good bounce and a closing today.
Can enter long on pullback at 50-61.8% fibonacci levels.
Target can be either of the two trendlines.
GRASIN_UPSIDE MOVE FROM TRENDLINEGRASIM is currently taking a support of a trendline.
One can go long from here with small qty.
(for educational purpose only)

GRASIM at crucial level. Good opportunity with small SLGRASIM at crucial level. Good opportunity with small SL


GRASIM INDUSTRIESGrasim is respecting the trendline and also it is near the support of 1484. It can bounce from here for targets of 1522 and 1545. Above 1550 closing , 1600 levels can be seen in Grasim. Keep stop loss below 1480.


