NSE:GRASIM Take Support around Levels of 869 on 30 min timeframeNSE: GRASIM Take Support around Levels of 869 on 30 min timeframe
Go long if Grasim Open Above Previous Close initial target Will be 910 - 926 and 942 With Risk reward ratio of 2.67
if Grasim opens below Previous Day Close wait Till Move above Previous day high in case of Gap down Ignore trade.
NSE:GRASIM
GRASIM trade ideas

#Grasim Swing Trade || Keep charts clean || Price is GodIf you keep your charts clean, then charts will talk to you and gives the buy/sell signal.
Click on chart for more info
Like || Comment || Follow || Share

Grasim |Head & Shoulder Pattern & 200ema breakdown🎯⭕ Intraday Trading opportunity ! min Chart Alert !!! ⭕
--Sell below = 900.40 or CMP
--Target =875.35 | 835.85
--Stop-loss = 912.30
--Lot Size = 950
--R:R = 3.91
--Expected Profit = 44,000 ₹ per lot ( 5.17 % )
--Expected Holding = 15 day only
#ThankU For Checking Out Our Content , We Hope U Liked IT 📌
======================================================
⭕ Technical Reasons to trade or Strategy applied :- ⭕
1) Head & Shoulder pattern breakdown
2) 200ema breakdown
3) inverted top setup
Guys check out the related ideas as well, it will work really well GUARANTEED !
🙏FOLLOW for more !
👍LIKE if think is useful !
✍COMMENT Below your view !


Grasim looking good for positional buyGrasim showing strength and giving sign of outperformance
It can see four digits in 1 years
Stop loss for longs is 650
NSE:GRASIM


Grasim | Trendline resistance break 🎯⭕ Swing Trading opportunity ! 30 min Chart Alert !!! ⭕
--Buy above =919.40 or CMP
--Target = 932 | 939.70
--Stop-loss =912.55
--Lot Size = 950
--R:R = 2.05
--Expected Profit = 19,200 ₹ per lot (2.21 % )
--Expected Holding = 5-15 day only
#ThankU For Checking Out Our Content , We Hope U Liked IT 📌
======================================================
⭕ Technical Reasons to trade OR Strategy applied :- ⭕
1) Trendline break , bought near support area after retracement
2) Volume is more than sufficient i.e engulfing pattern & bullish candlestick pattern
3) Uptrend Is continuing and Trendline resistance break
4) All the possible support & resistance is mentioned on the chart
======================================================
Guys check out the related ideas as well, it will work really well GUARANTEED !
🙏FOLLOW for more !
👍LIKE if think is useful !
✍COMMENT Below your view !

Grasim Short term Trade ideaPlease note, I am new to trading and all the ideas posted are for educational purpose only,
Here looking for advises and correction from experienced Community members/


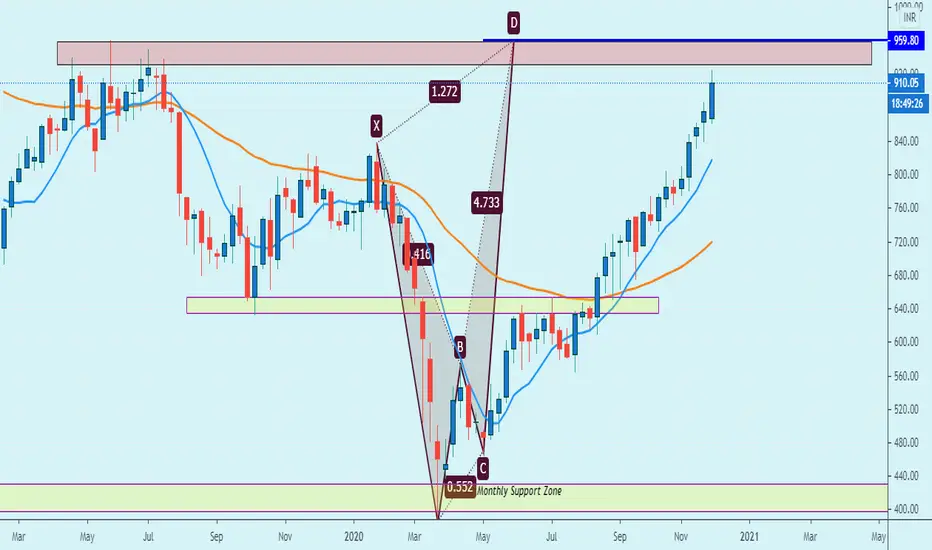
GRASIM On Daily charts, the stock has formed a BUtterfiy Bearish pattern and can retrace upto 860.
Charts are for Educational purpose.

Grasim intraday tradeGrasim has given a nice breakout on daily charts
if 15 min candle closes above 750 there are chances of given target


GRASIM : algo demonstrationHOW TO FOLLOW ALGO SIGNAL:
Deciding buy/sell
1.Strictly use only on 1 hour time frame.
2.Wait for a ‘X’ sign before mind make up. A red ‘X’ means look for selling opportunity , a green ‘X’ means look for buying opportunity.
Taking a position:
3.Wait for an arrow before entering into any position. A red arrow on upside of a bar pointing downward means open short position. A green arrow below the bar pointing upward means open buy position.
4.NOTE: Only after the the signalling of X , look for arrow. Do not buy/sell if you see any arrow before the signal of X.
5.STOP LOSS should be the most recent swing high/low or most recent STRONG CANDLE’S high/low.
While maintaining the position :
6.The small triangles after the each bar completion tells you to hold the position. The red triangles appearing upside on the bar tells you to hold the short position, whereas the green triangles appearing below the bars tells you to hold the long position.
Exiting the position:
7.After you create a buy position , if you see a green arrow above any bar pointing downward, then you should either book partially/leave the position for sometime. You will get another signal to re-enter.
8.Similarly, after you create a sell position , if you see a red arrow below any bar pointing upward, then you should either book partially/leave the position for sometime. You will get another signal to re-enter.
9.While being in position if you see any X signal which is opposite of your trade , then leave your position immediately.
10.When you see a big red circle dot then you must exit all your short positions. Contrary , when you see a big green circle dot , you must exit all your long positions. And then wait for a X-signal.
No Trading Zone:
11.When you get frequent X-signals in green-red-green-red & that too very close, then its means that stock is going to form a range. One should wait for the range break & move away to another stock. (THIS IS WHERE YOU WILL REQUIRE A PRACTICE TO IDENTIFY THE RANGE)


GRASIM 1DSTOCK:- GRASIM
CMP 906
TARGETS:- 950.50, 970 and 1020
SL:- 870 on closing basis
The stock has given a bullish channel breakout on daily time frame
The stock is now ready to inch further for the targets.
One can go long for the TARGETS

GO LONG GRASIMGrasim has given very good breakout after consolidation(build up) and made a new 52 week high. It can go up very quickly from these levels. Anyone can confirm brekout from lower timeframes.
