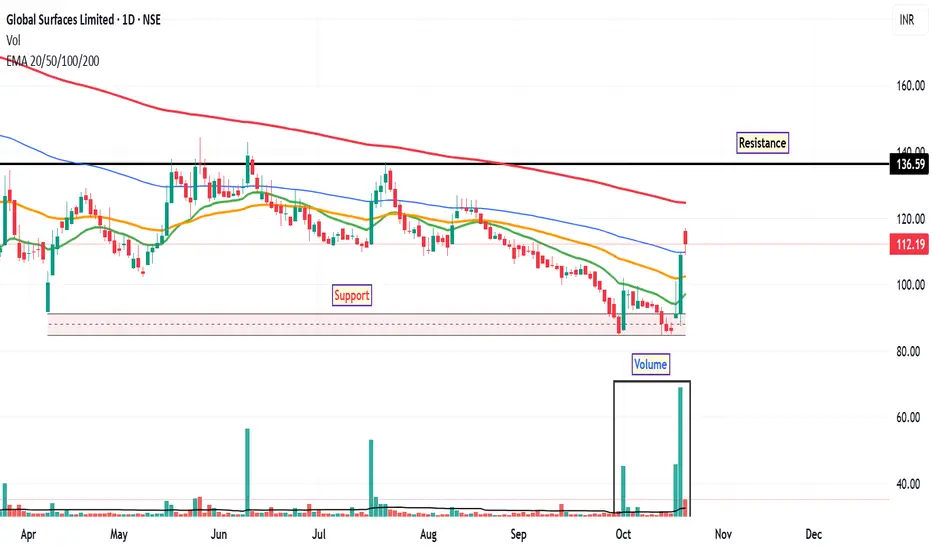
GSLSU: Trend Reversal Signals The stock of GSLSU has been in a sustained downtrend since May, revisiting its discount zone multiple times. However, recent price action suggests a possible shift in sentiment. On Friday, October 17, the daily chart printed an inverted hammer candlestick, a pattern often interpreted by technical
Global Surfaces Limited
No trades
−4.39 INR
−285.35 M INR
2.07 B INR
16.48 M
About Global Surfaces Limited
Sector
Industry
CEO
Mayank Shah
Website
Headquarters
Jaipur
Founded
1991
IPO date
Mar 23, 2023
Identifiers
2
ISIN INE0JSX01015
Global Surfaces Ltd. engages in the manufacturing of quartz and processing granite and marble. The company was founded on August 23, 1991, and is headquartered in Jaipur, India.
Related stocks
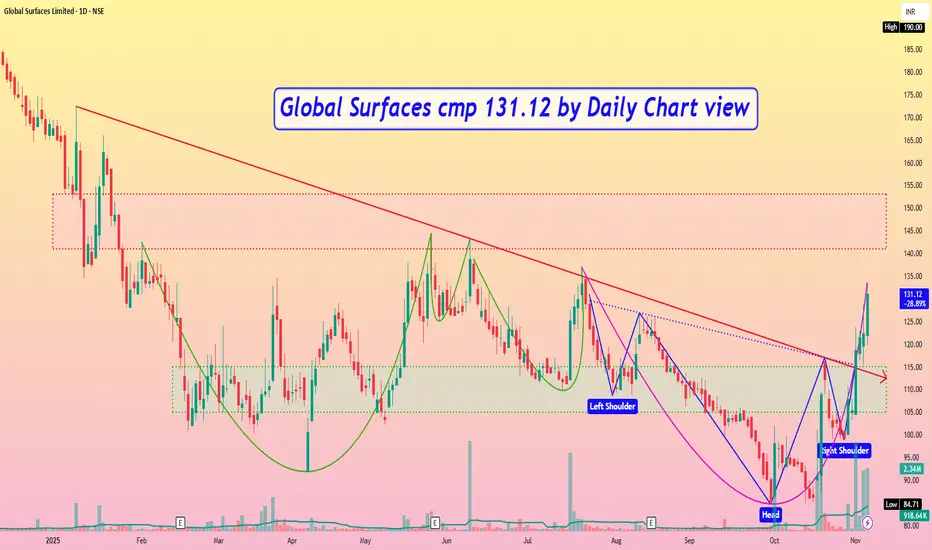
Global Surfaces cmp 131.12 by Daily Chart viewGlobal Surfaces cmp 131.12 by Daily Chart view
- Support Zone 105 to 115 Price Band
- Resistance Zone 141 to 153 Price Band
- Multiple Bullish Technical Chart patterns done
- Falling Resistance Trendline Breakout well sustained
- Majority of Technical Indicators seen trending positively
Checkout an amazing breakout happened in an IPO Stock - GSLSUThe magic here is to make sure we are investing in an IPO stock which is about to fly for a long term. We are studying the trend and not jumping into the stock quickly. Instead we are waiting and placing the order in a particular BO level.
Catching the early birds in the stock market and not everyo

Breakout in Global Surfaces Ltd...Chart is self explanatory. Levels of breakout, possible up-moves (where stock may find resistances) and support (close below which, setup will be invalidated) are clearly defined.
Disclaimer: This is for demonstration and educational purpose only. This is not buying or selling recommendations. I am

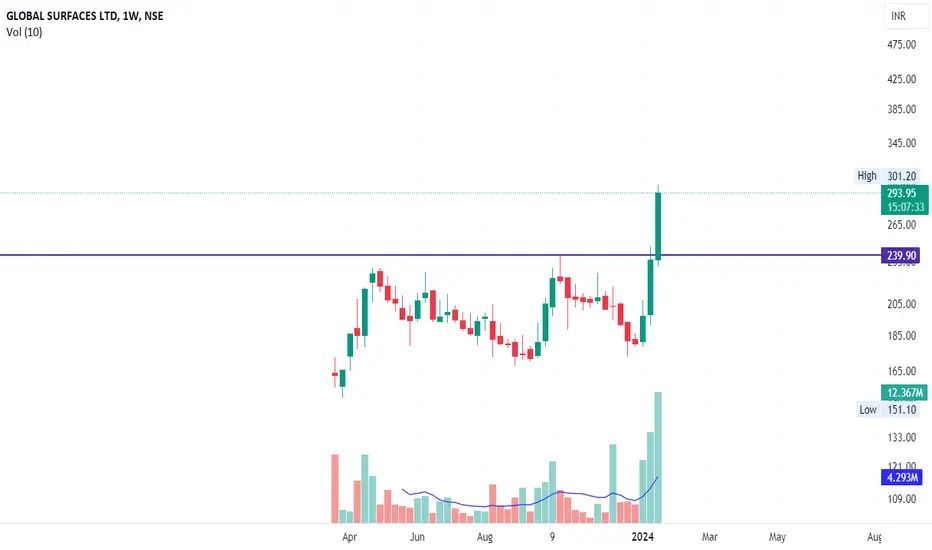
GSLSU / Global Surfaces Ltd - Consolidation / IPO Base BreakoutGSLSU
1) Time Frame - Weekly.
2) Previous Life Time High was 239.30. It has been consolidating since 2023, March & given a breakout in weekly time frame currently.
3) It's a consolidation / IPO base breakout with strong bullish candle & Good volume.
4) Recommendation - Strong Buy
Global Surfaces Ltd
Prices have cleared its previous all time high of 230.
Volumes in this rally have been higher than average, confirming strength.
RSI has also cleared 60, suggest bullish trend.
Bullish outlook remains valid as long as price is above 226.

GSLSU - First BreakoutDetailed View about this Breakout:
No.of Resistance: 4
No.of Support: 4
Consolidation Days: 170+ Days
I Post educational chart for 3 Swing / Potential Stocks Everyday.
Check Related Ideas section for more Swing Stock analysis.


See all ideas
Summarizing what the indicators are suggesting.
Oscillators
Neutral
SellBuy
Strong sellStrong buy
Strong sellSellNeutralBuyStrong buy
Oscillators
Neutral
SellBuy
Strong sellStrong buy
Strong sellSellNeutralBuyStrong buy
Summary
Neutral
SellBuy
Strong sellStrong buy
Strong sellSellNeutralBuyStrong buy
Summary
Neutral
SellBuy
Strong sellStrong buy
Strong sellSellNeutralBuyStrong buy
Summary
Neutral
SellBuy
Strong sellStrong buy
Strong sellSellNeutralBuyStrong buy
Moving Averages
Neutral
SellBuy
Strong sellStrong buy
Strong sellSellNeutralBuyStrong buy
Moving Averages
Neutral
SellBuy
Strong sellStrong buy
Strong sellSellNeutralBuyStrong buy
Displays a symbol's price movements over previous years to identify recurring trends.
Frequently Asked Questions
The current price of GSLSU is 89.87 INR — it has increased by 0.75% in the past 24 hours. Watch Global Surfaces Limited stock price performance more closely on the chart.
Depending on the exchange, the stock ticker may vary. For instance, on NSE exchange Global Surfaces Limited stocks are traded under the ticker GSLSU.
GSLSU stock has risen by 10.28% compared to the previous week, the month change is a −10.58% fall, over the last year Global Surfaces Limited has showed a −32.63% decrease.
GSLSU reached its all-time high on Feb 7, 2024 with the price of 333.00 INR, and its all-time low was 79.00 INR and was reached on Jan 27, 2026. View more price dynamics on GSLSU chart.
See other stocks reaching their highest and lowest prices.
See other stocks reaching their highest and lowest prices.
GSLSU stock is 2.47% volatile and has beta coefficient of 1.14. Track Global Surfaces Limited stock price on the chart and check out the list of the most volatile stocks — is Global Surfaces Limited there?
Today Global Surfaces Limited has the market capitalization of 3.78 B, it has increased by 0.93% over the last week.
Yes, you can track Global Surfaces Limited financials in yearly and quarterly reports right on TradingView.
GSLSU net income for the last quarter is −30.10 M INR, while the quarter before that showed −46.65 M INR of net income which accounts for 35.48% change. Track more Global Surfaces Limited financial stats to get the full picture.
No, GSLSU doesn't pay any dividends to its shareholders. But don't worry, we've prepared a list of high-dividend stocks for you.
As of Feb 5, 2026, the company has 235 employees. See our rating of the largest employees — is Global Surfaces Limited on this list?
EBITDA measures a company's operating performance, its growth signifies an improvement in the efficiency of a company. Global Surfaces Limited EBITDA is 57.17 M INR, and current EBITDA margin is 0.95%. See more stats in Global Surfaces Limited financial statements.
Like other stocks, GSLSU shares are traded on stock exchanges, e.g. Nasdaq, Nyse, Euronext, and the easiest way to buy them is through an online stock broker. To do this, you need to open an account and follow a broker's procedures, then start trading. You can trade Global Surfaces Limited stock right from TradingView charts — choose your broker and connect to your account.
Investing in stocks requires a comprehensive research: you should carefully study all the available data, e.g. company's financials, related news, and its technical analysis. So Global Surfaces Limited technincal analysis shows the neutral today, and its 1 week rating is sell. Since market conditions are prone to changes, it's worth looking a bit further into the future — according to the 1 month rating Global Surfaces Limited stock shows the sell signal. See more of Global Surfaces Limited technicals for a more comprehensive analysis.
If you're still not sure, try looking for inspiration in our curated watchlists.
If you're still not sure, try looking for inspiration in our curated watchlists.