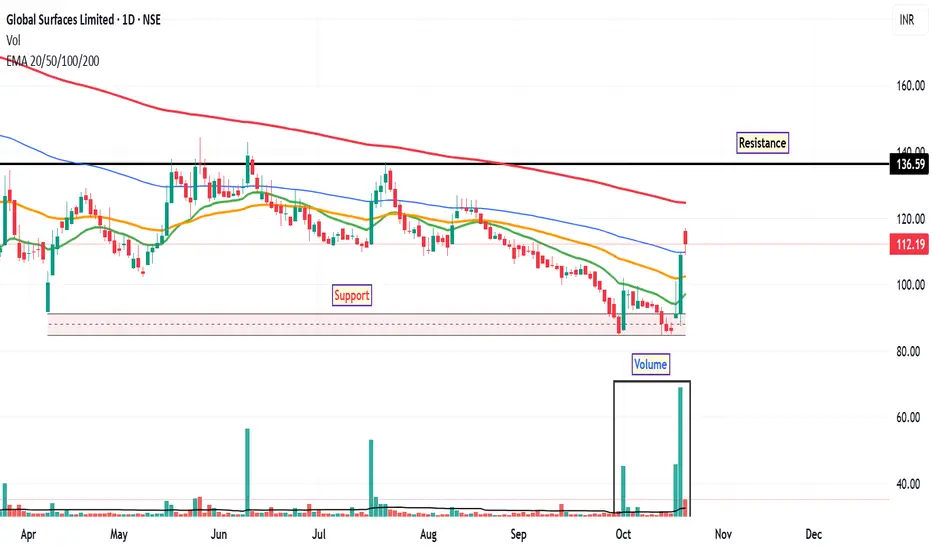
GSLSU: Trend Reversal Signals The stock of GSLSU has been in a sustained downtrend since May, revisiting its discount zone multiple times. However, recent price action suggests a possible shift in sentiment. On Friday, October 17, the daily chart printed an inverted hammer candlestick, a pattern often interpreted by technical analysts as a potential bullish reversal signal—especially when supported by volume and other indicators.
The inverted hammer on the daily timeframe may indicate buying interest at lower levels. This pattern gains significance when it appears after a prolonged downtrend and is accompanied by increased volume. The bullish signal is further supported by a rise in trading volume and a daily close above the 20-day, 50-day, and 100-day EMAs, suggesting short-term strength and potential trend reversal.
In the most recent trading session, the stock found support at the 100-day EMA and rebounded, reinforcing the validity of this level as a short-term base. The RSI has moved above 65, indicating increasing bullish momentum. This level is often seen as a sign of strengthening trend, though not yet in overbought territory.
If the stock sustains its upward movement, the next potential resistance level may be around ₹136 , based on previous price action. The discount zone near ₹84 may serve as a key support level. Traders often monitor such zones for invalidation of bullish setups or potential re-entry points.
Disclaimer: This analysis is intended for educational and informational purposes only. It does not constitute investment advice or a recommendation to buy, sell, or hold any financial instrument. Market participants should conduct their own research and consult with a licensed financial advisor before making any investment decisions.
Global Surfaces Limited
No trades
Trade ideas
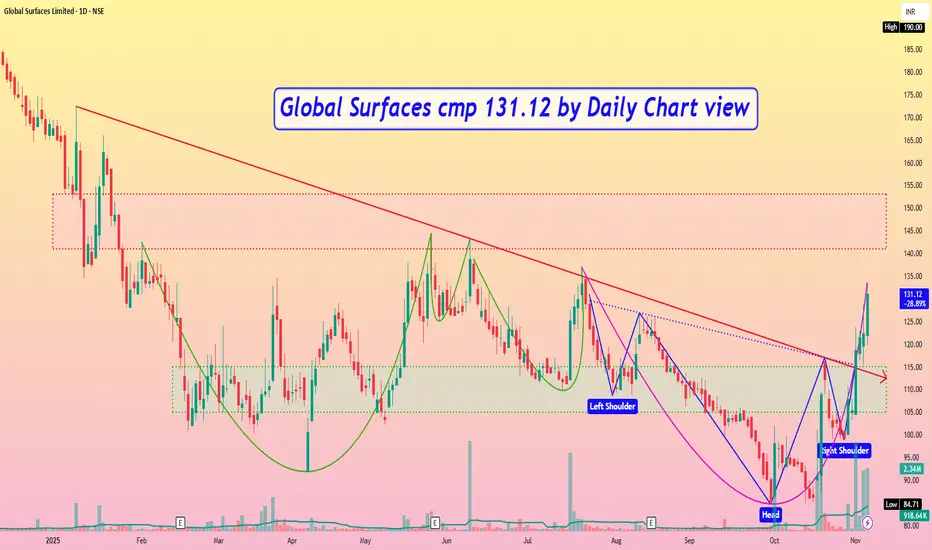
Global Surfaces cmp 131.12 by Daily Chart viewGlobal Surfaces cmp 131.12 by Daily Chart view
- Support Zone 105 to 115 Price Band
- Resistance Zone 141 to 153 Price Band
- Multiple Bullish Technical Chart patterns done
- Falling Resistance Trendline Breakout well sustained
- Majority of Technical Indicators seen trending positively
Checkout an amazing breakout happened in an IPO Stock - GSLSUThe magic here is to make sure we are investing in an IPO stock which is about to fly for a long term. We are studying the trend and not jumping into the stock quickly. Instead we are waiting and placing the order in a particular BO level.
Catching the early birds in the stock market and not everyone (especially retail traders) can do it. The art is investing fixed amount equally in every stock and let the law of numbers work on compounding in the longer run,
Example: 5000/- invested equally in all Bo stocks where out of 15 stocks only 1-2 stocks goes beyond -50% SL, where rest of the stocks flys like an eagle. The secret recipe is "Patience with correct study" and "Large diversification" and "TIME"
The real deal is when to purchase and where to purchase the stock. That is where Breakout study comes into play.
LET'S PUMP IN SOME MONEY AND REVOLUTIONIZE THE NATION'S ECONOMY!

Breakout in Global Surfaces Ltd...Chart is self explanatory. Levels of breakout, possible up-moves (where stock may find resistances) and support (close below which, setup will be invalidated) are clearly defined.
Disclaimer: This is for demonstration and educational purpose only. This is not buying or selling recommendations. I am not SEBI registered. Please consult your financial advisor before taking any trade.

GSLSU / Global Surfaces Ltd - Consolidation / IPO Base BreakoutGSLSU
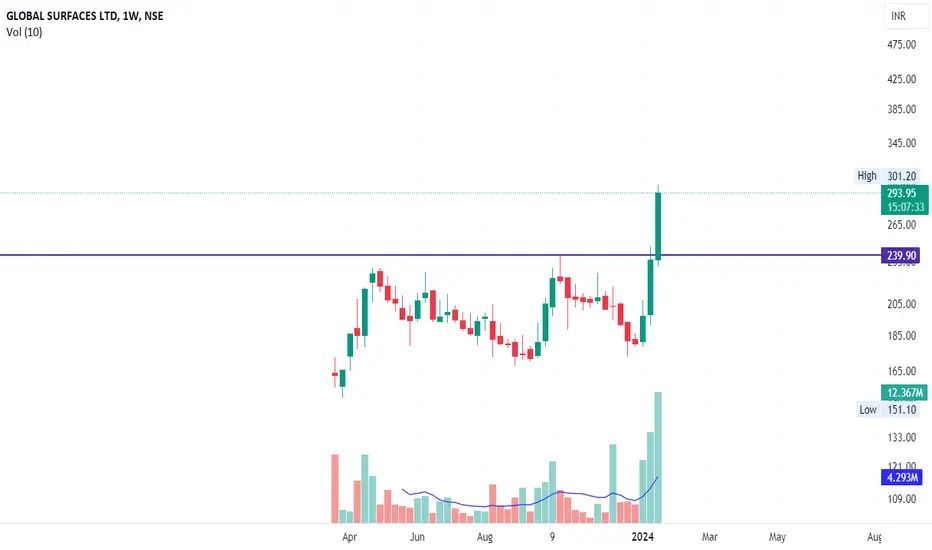
1) Time Frame - Weekly.
2) Previous Life Time High was 239.30. It has been consolidating since 2023, March & given a breakout in weekly time frame currently.
3) It's a consolidation / IPO base breakout with strong bullish candle & Good volume.
4) Recommendation - Strong Buy
Global Surfaces Ltd
Prices have cleared its previous all time high of 230.
Volumes in this rally have been higher than average, confirming strength.
RSI has also cleared 60, suggest bullish trend.
Bullish outlook remains valid as long as price is above 226.

GSLSU - First BreakoutDetailed View about this Breakout:
No.of Resistance: 4
No.of Support: 4
Consolidation Days: 170+ Days
I Post educational chart for 3 Swing / Potential Stocks Everyday.
Check Related Ideas section for more Swing Stock analysis.

