GVT&D Price ActionGE Vernova T&D India Ltd (GVT&D) has experienced a significant surge, with its stock price around ₹2,597 as of July 30, 2025. Over the past year, the stock delivered an impressive return of about 61%. Over three years, the returns are even more dramatic, exceeding 2,100%. However, the broader financials reveal a company with mixed metrics.
The stock’s high price-to-earnings (P/E) ratio and price-to-book value suggest it is currently overvalued compared to peers and the market average. Analyst forecasts for the next 12 months range between ₹2,005 and ₹3,000, with a consensus target near ₹2,450. Most analysts continue to view the stock favorably and assign it a “strong buy” outlook, though with caution about its rich valuation.
GVT&D’s profitability stands out; it has shown robust growth in both operating profit and earnings per share recently. Return on equity has climbed above 40% in the past year, indicating efficiency in generating returns for shareholders. The company is also almost debt-free and maintains stable cash flows, which reduces financial risk.
Volatility for GVT&D is slightly higher than the market average, but price movement has been relatively stable, with no extreme swings in recent months. Still, investors should be aware that such high past returns may not be sustainable, especially with modest sales growth and valuation multiples well above industry norms.
In summary, GVT&D remains a high-performing and highly-valued stock in the Indian power equipment sector, with strong recent momentum, robust profitability, and a largely positive market outlook—albeit with potential risk due to elevated pricing and slower sales growth compared to its historic surge.
GVT&D trade ideas

GE Vernova T&D India – Q1 FY26 RESULTS + CHART ANALYSIS
## 🚀 GE Vernova T\&D India – Q1 FY26 RESULTS + CHART ANALYSIS
### 🔹 Fundamentals (Q1 FY26 – ended June 30, 2025)
* **Revenue**: ₹1,330 Cr, up **39% YoY** (₹958 Cr in Jun 2024)
* **EBITDA**: ₹388 Cr, up **113% YoY**, margin expansion to \~29%
* **Net Profit**: ₹291 Cr, up **116% YoY**
* **EPS**: ₹11.37 vs ₹5.25 last year
* **Order Bookings**: ₹1,620 Cr (+57% YoY) → strong visibility
**Management View**: Growth supported by India’s **grid modernization**, selective high-margin orders, and strong execution. Free cash flow remains healthy.
---
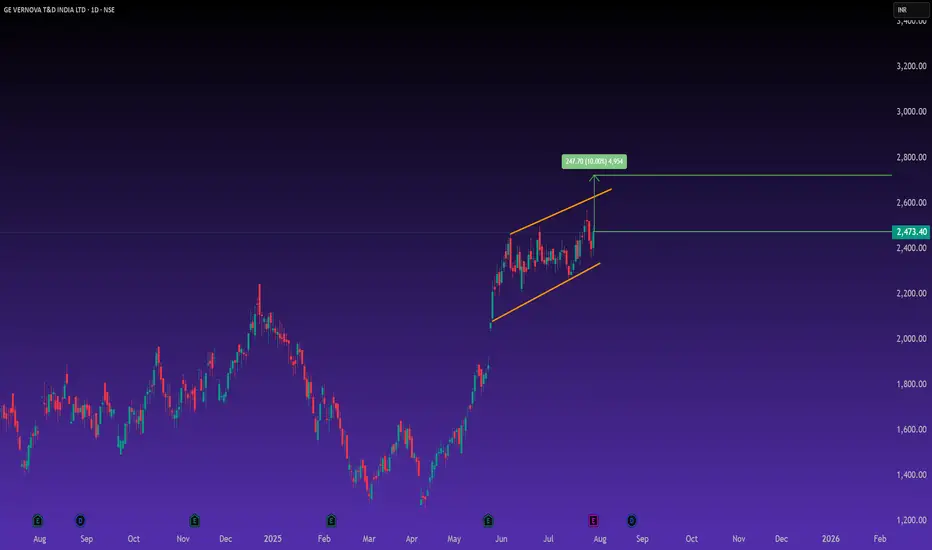
### 📈 Technical Setup
* Stock trading in an **upward channel** since June.
* Current Price: **₹2,476**
* **Resistance**: \~₹2,500 → breakout level.
* **Support**: ₹2,420–2,430.
* **Upside Target**: ₹2,700–2,750 (≈10% potential) if breakout sustains.
* Bias remains **bullish** above support.
---
### ⚙️ Broader Catalysts
* Big contract win for 765 kV transformers & shunt reactors from **POWERGRID**, deliveries from 2026.
* Part of global **GE Vernova Electrification segment**, benefiting from AI/data center energy demand + renewable integration.
* Valuations remain rich (PE \~83), but growth visibility keeps investor confidence high.
---
### 🧭 Levels to Watch
| Parameter | Level |
| --------- | ------------ |
| Support | ₹2,420–2,430 |
| Breakout | ₹2,500 |
| Target | ₹2,700–2,750 |
| Risk Zone | Below ₹2,400 |
---
✅ **Conclusion**: GE Vernova T\&D posted **stellar earnings** with strong margins and a robust order pipeline. Technically, a breakout above ₹2,500 could lead to the next leg higher. The company is well-placed to ride India’s power grid and renewable push.
---
⚠️ **Disclaimer**: This analysis is for **educational and informational purposes only**. It is **not investment advice** or a stock recommendation. Please **do your own research (DYOR)** or consult a SEBI-registered advisor before making any investment decisions
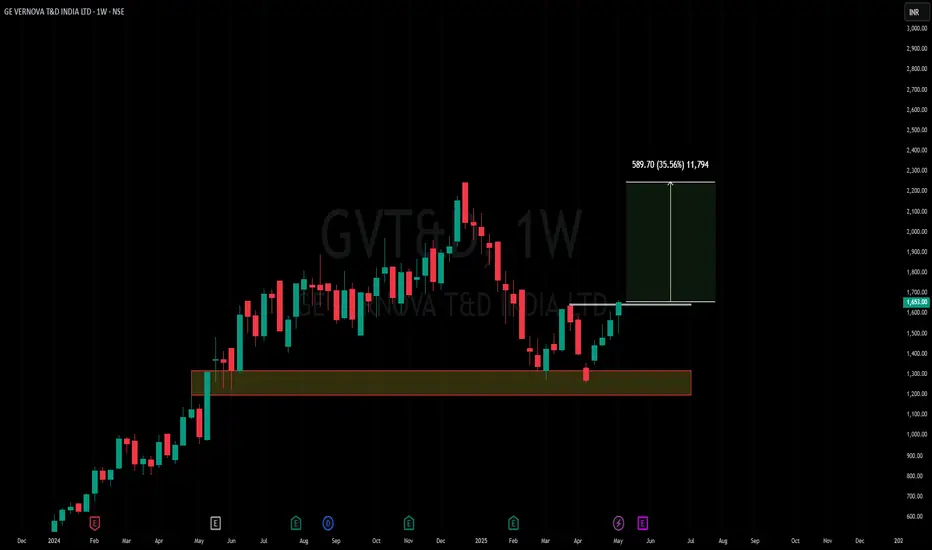
Amazing breakout on WEEKLY Timeframe - GVT&DCheckout an amazing breakout happened in the stock in Weekly timeframe, macroscopically seen in Daily timeframe. Having a great favor that the stock might be bullish expecting a staggering returns of minimum 25% TGT. IMPORTANT BREAKOUT LEVELS ARE ALWAYS RESPECTED!
NOTE for learners: Place the breakout levels as per the chart shared and track it yourself to get amazed!!
#No complicated chart patterns
#No big big indicators
#No Excel sheet or number magics
TRADE IDEA: WAIT FOR THE STOCK TO BREAKOUT IN WEEKLY TIMEFRAME ABOVE THIS LEVEL.
Checkout an amazing breakout happened in the stock in Weekly timeframe.
Breakouts happening in longer timeframe is way more powerful than the breakouts seen in Daily timeframe. You can blindly invest once the weekly candle closes above the breakout line and stay invested forever. Also these stocks breakouts are lifelong predictions, it means technically these breakouts happen giving more returns in the longer runs. Hence, even when the scrip makes a loss of 10% / 20% / 30% / 50%, the stock will regain and turn around. Once they again enter the same breakout level, they will flyyyyyyyyyyyy like a ROCKET if held in the portfolio in the longer run.
Time makes money, GREEDY & EGO will not make money.
Also, magically these breakouts tend to prove that the companies turn around and fundamentally becoming strong. Also the magic happens when more diversification is done in various sectors under various scripts with equal money invested in each N500 scripts.
The real deal is when to purchase and where to purchase the stock. That is where Breakout study comes into play.
LET'S PUMP IN SOME MONEY AND REVOLUTIONIZE THE NATION'S ECONOMY!
GVT&DGVT&D giving trendline breaout with increased volume. Coming out of the zone and seems ready for the next run. Keep it on radar.
