HAL likely to fall ???forming a rising wedge, if breakdown its level likely to come post Covid recovery level, there is a huge divergence as well , which will resolve if it comes back to 1300 level , which is approx. 50% of wedge's breakdown target. Also seems 5th of 5th Elliot wave pattern.
HAL trade ideas


[Positional] HAL Swing BetNote -
One of the best forms of Price Action is to not try to predict at all. Instead of that, ACT on the price. So, this chart tells at "where" to act in "what direction. Unless it triggers, like, let's say the candle doesn't break the level which says "Buy if it breaks", You should not buy at all.
=======
I use shorthands for my trades.
"Positional" - means You can carry these positions and I do not see sharp volatility ahead. (I tally upcoming events and many small kinds of stuff to my own tiny capacity.)
"Intraday" -means You must close this position at any cost by the end of the day.
"Theta" , "Bounce" , "3BB" or "Entropy" - My own systems.
=======
I won't personally follow any rules. If I "think" (It is never gut feel. It is always some reason.) the trade is wrong, I may take reverse trade. I may carry forward an intraday position. What is meant here - You shouldn't follow me because I may miss updating. You should follow the system I share.
=======
Like -
Always follow a stop loss.
In the case of Intraday trades, it is mostly the "Day's High".
In the case of Positional trades, it is mostly the previous swings.
I do not use Stop Loss most of the time. But I manage my risk with options as I do most of the trades using derivatives.
=======

HAL ripe for Short tradeMultiple reasons supporting short trade in HAL
1) Upper channel resistance
2) Bearish Inside candle pattern breakdown confirmation by todays close.
3) Almost vertical trendline break
target 1736 SL 1942

HAL - H&S BreakoutHAL has given a Inverted Head and Shoulder breakout and also momentum indicators are also signalling bullish signs.
NOTE - THIS IS JUST FOR EDUCATIONAL PURPOSE AND TRADE ON YOUR OWN RISK WITH CONSULT OF YOUR ADVISOR

NSE India - short opptyShort CMP , TG1 - 1750 / TG2 - 1650 . SL - 1930 (Just a swing opportunity...long term trend is up)

Break the traingle pattern and stands on all time high See the chart of HAL who is break the traingle pattern with veri good volume and stands on all time high. Buy call hal Jun 2120 ce and sit relax.


Hindustan Aeronautics LtdThinking of going long.
Stock is currently at 52 week high, RSI is also near to 70. Expecting some more upside from here.
Fundamental of HAL is also good one can consider going long in this.
Note :This is not a stock recommendation. Before taking any position it is advised to consult your financial advisor.

Swing Trade Opportunity in HALSwing Trade Opportunity in HAL.
Entry: 1600
Target: 1750
DISCLAIMER: The ideas shared are only for educational purpose. I am not SEBI registered.

HAL is looking very strong.HAL has retested all time high.And consistently outperforming the market.

#StockMarket #StockIdeas #StocktoWatch #StockToBuy #positionalHAL
Stock after giving good breakout, retraced to its breakout levels and then again started Upside movement.
Showing good example of breakout, pullback, retest and continuation.
Buy at CMP also with positional view for minimum 3-5% targets.
----
Note:
Above levels are for education purposes only
Do your own analysis before taking any trade
Please Like & Follow

HAL Ichimoku Bullish Breakout Stock Name - HAL. As per the ichimoiku rule, today's close is above the Conversion Line and future kumo
is super bullish and chikou span is slanting upwards. All these parameters are showing bullishness.
More strength will be visible once it will sustain above 1680. Worth to keep in watch list for coming days.
#This is not Buy and Sell recommendation to any one. This is for education purpose and a helping hand to learn trading in Market.
# Rule Based Investing
# Ichimoku Cloud
# Ichimoku Followers
I hope you all like my analysis. Please do share your thoughts into comment section of Trading View.
Please give a like, it motivates me to do analysis and do share our channel with your friends as well.

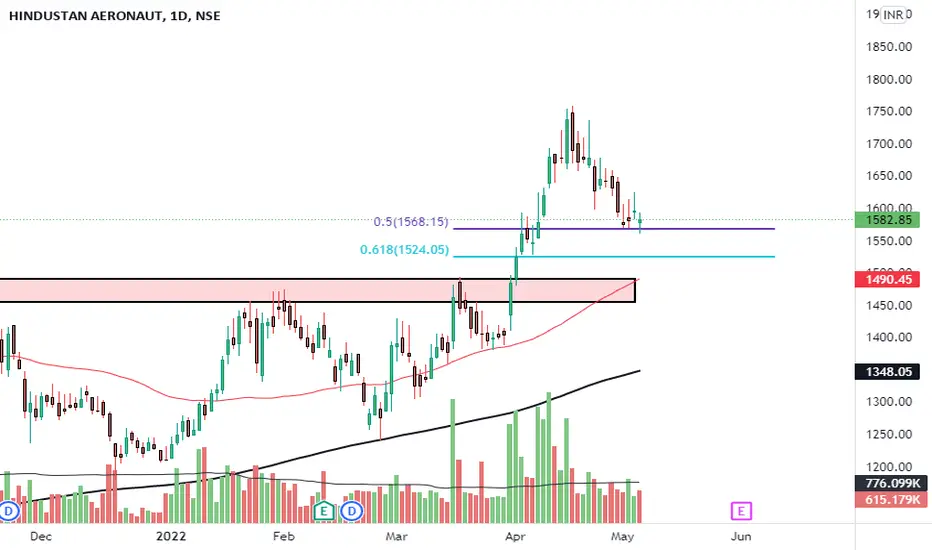
HAL important FIB level RetracementHAL after Breakout Rally now retracing back to Important Fib level . Once you get WR candle with good volume at this level initiate long trade . SL Below 1524 level . Because of market condition stock specific rally is in my focus . Also take care of your position size .once the market stabilize and shows strength add your balance position . Happy trading Guys.
Looking good for upmoveThis is a classic case of breakout, pullback, retest and continuation.
All details marked on chart.
Intraday players buy above 1610. Safe buy above 1625
Disclaimer - This idea is for educational purpose and kindly buy as per your risk management. I always encourage partial booking 1-2% profits and use a strict trailing stop loss.
Learn & Earn,
Dr . Tanya Kumar

#HAL - RT Idea#HAL - RT Idea
CMP : 1509.90
Disclaimer : We are not Sebi registered analyst or Authorized analyst
The charts / Levels / Price projections are only for educational purpose.
This is our personal view, Pls consult your financial advisor before taking decision - Buy / Sell
We will be not responsible for your profit and Loss
Please like and retweet if you like this idea.

Hindustan Aeronautics Ltd. HAL Chart Analysis !!📈 Hindustan Aeronautics Ltd. (HAL) 📉
This Stock Broke out from a Resistance zone of 1460-1480 after testing five times this range on upside with a strong green candle. If you look closely it has spend around seven months below this level. So It makes this Strong breakout.
Bias - Long
Target - 1600, 1700, 1800
SL - 1394
RR- 1 : 2.5
All Important Supports and Resistances are drawn in chart. All levels are on closing basis.
Please have a look and revert back if you need some more study on it.
Disclaimer : Consult Your Financial Advisor Before Taking Any Decision On This Analysis.

HAL ready for a cup and handle breakout1. Buy or Sell at your own risk
2. Don't risk more than 1%-2% of your capital as stop loss
3. Position Size formula:- Stop Loss Amount/(Buy Price-Initial Stop Loss Price)
4. Sell on initial stop loss hit or close below daily supertrend (for short term traders) or close below weekly supertrend (for long term investors)
5. Some other ways to sell stocks can be
a. 25% or 50% up in three weeks or less
b. Weekly tailing tops with high volume
c. Exhaustion gaps
d. Heavy daily volume without further upside
e. Largest one day price drop
After a consolidation since September 2021 (if we look at the weekly charts then we can see that the consolidation has been going on since August 2020), NSE:HAL is going to break out from a cup and handle pattern. Volume is also increasing. If the stock breaks out above Rs.1500 then it will be a good buy with the stop just below Rs.1400.
Other fundamentals:
1. India will 'possibly' not import any defence items going forward: Defence Ministry official
2. Hindustan Aeronautics Limited informed that in a major boost to Atmanirbhar Bharat Mission, as per Press Information Bureau, CCS has approved the procurement of 15 Light Combat Helicopters (LCH) Limited Series Production (for Indian Air Force 10 and Indian Army 5) from the Company.
3. Average Roe for last 3 and 5 years more than 15%
4. Borrowings came down from nearly 6000 crores in March 2020 to 6 crores in September 2021
5. Dividend yield of 2.69% (consistent dividend payer since 2016)
6. Debt to equity at 0.00 (less than 1 is good), Interest Coverage at 106 (greater than 3 is good), Current ratio at 1.65 (greater than 1.5 is good).
7. FII stake increased from 0.30% in December 2020 to 3.15% in December 2021.

“Rounding Bottom” formation BreakoutOn the weekly chart, the has confirmed “rounding bottom” formation breakout at 1500 levels on a closing basis
It has also confirmed higher tops and bottoms indicating strong up trend
The stock has recaptured its 20, 50, ,100 and 200 day SMA and rebounded very sharply
Huge volumes around breakout zone implies increased participation
The daily and weekly strength indicator RSI signals positive crossover indicate rising strength
The above analysis indicate upside of 1685 levels.
Holding period is 3 to 4 weeks.

Classic W Pattern in makingW and M patterns are classic patterns of a breakout or breakdown moves. In this case, W pattern gives a trader a better probability to profit over time if identified well in time.
The stock in action here is HAL.

HAL going down for short termShort swing trading opportunity in HAL.
on 15 minutes chart it has formed head and shoulder

TARGET 1 Achieved in HAL 20% profit done, Ready for new highsHAL after forming IH&S breakout above levels marked on the chart with great volumes. Post this breakout target 1 is now achieved.
Kindly check previous HAL idea posted with all details.
Levels are explained in charts
Disclaimer: This study is for educational purpose only & is not buying or selling recommendations. I am not SEBI registered. Please consult your financial advisor before taking any trade.

BULLISH IN HALAfter breakout of ATH, Hal if retraces back to the levels , drawn in chart.. it is a buy
