HAVELLS BULLISH SWING TRADE [WEEKLY]There is a familiar support around 1466 and the stock is also on a sideways range on the weekly chart. We can use that to our benefit. There is also a symmetrical triangle pattern which does not seem to give a clear indication of a particular trend. However, the quarter 2 results of Havells have seen its profits increase nd there will be a sure play at buying this stock. My trade would be -
ENTRY - 1497
EXIT - 1597
SL - 1440
Disclaimer - This is for learning purpose only. It should not be considered as a financial advice.
Trade ideas

HAVELLS 🧩 Havells India – Inverse Head & Shoulders Breakout Formation (Bullish Reversal Setup)
🧠 Description:
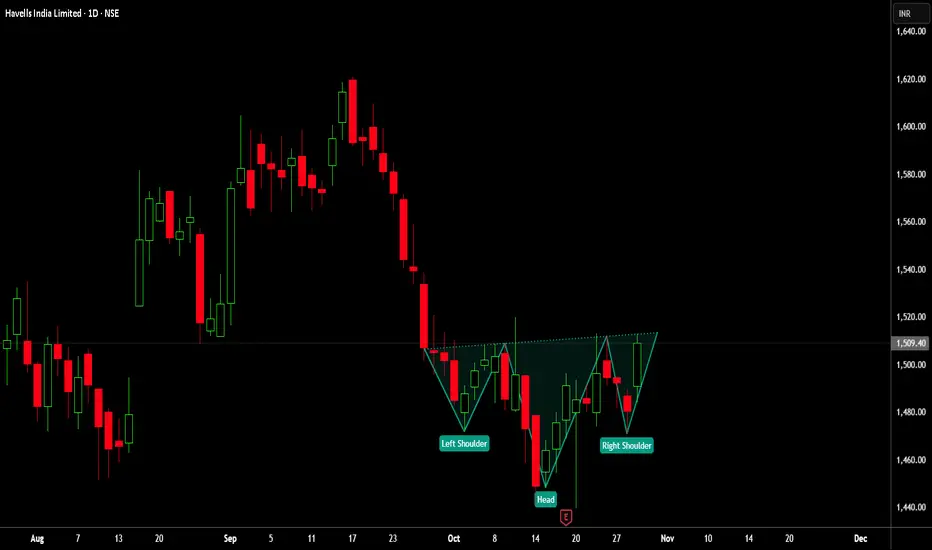
The Havells India Ltd (Daily) chart is displaying a potential Inverse Head & Shoulders pattern — a classic bullish reversal formation often seen near market bottoms.
🏗️ Pattern Structure:
The Left Shoulder formed in early October 2025.
The Head was completed near mid-October with a strong rejection candle around ₹1,440.
The Right Shoulder is now shaping up with consistent higher lows, showing accumulation signs.
The Neckline Resistance lies near ₹1,515–₹1,520.
A breakout and daily close above the neckline could trigger further upside momentum.
📊 Technical Highlights:
RSI: Recovered from oversold zone and sustaining above 50 — confirming bullish momentum.
Volume: Gradual rise in volume indicates possible institutional participation.
Trend Structure: Formation of higher highs and higher lows post-head formation.
🔑 Key Levels:
📍 Neckline Zone: ₹1,515–₹1,520
📍 Breakout Confirmation: Daily close above ₹1,520
📍 Immediate Target: ₹1,560
📍 Extended Target: ₹1,600–₹1,625
📍 Stop Loss: Below ₹1,470 (Right Shoulder low)
🧭 Trading Plan:
✅ Entry: On sustained move or daily close above ₹1,520
🔒 Stop Loss: Below ₹1,470
🎯 Targets: ₹1,560 → ₹1,625
📈 View:
Bullish (Swing/Positional) — If the neckline breakout sustains, Havells India could see momentum continuation toward higher resistance levels.
📰 Watchlist Note:
Keep this setup under your watchlist for breakout confirmation.
Always Do Your Own Research (DOYR) before acting.
❌ No Buy/Sell Recommendation.
🙏 Thank You for Reading!
👍 BOOST if you found this useful.
📌 FOLLOW for more market setups.
💬 COMMENT below with your analysis or feedback.
⚠️ Disclaimer:
I am not a SEBI REGISTERED RESEARCH ANALYST AND INVESTMENT ADVISER.
This analysis is intended solely for informational purposes and should not be interpreted as financial advice.
Please consult a qualified financial advisor or conduct thorough research before making investment decisions.
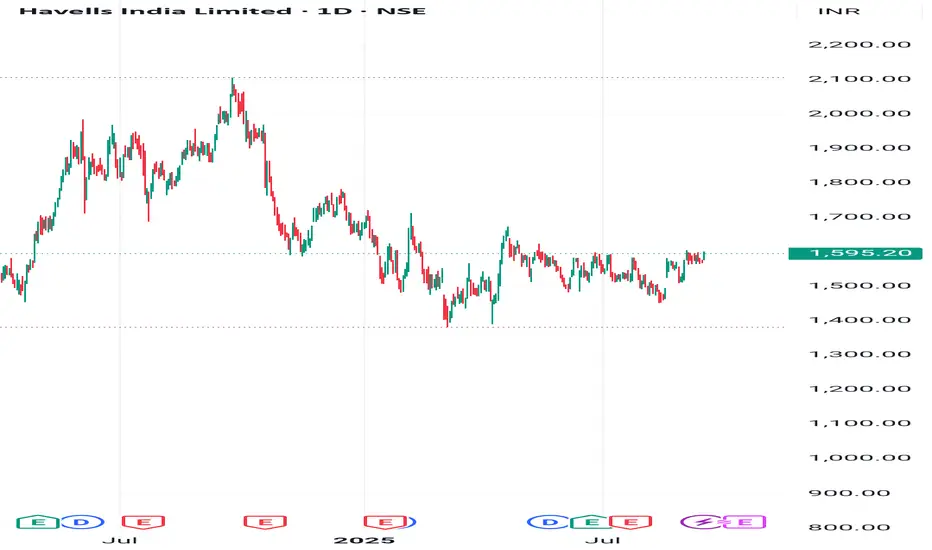
HAVELLS 1 Day Time Frame 📊 Key Support and Resistance Levels
Immediate Support: ₹1,477.53
Immediate Resistance: ₹1,527.85
Short-Term Support: ₹1,497.04
Short-Term Resistance: ₹1,538.60
Fibonacci Pivot Point: ₹1,462.70
These levels are derived from standard technical analysis tools and are relevant for intraday trading strategies.
📉 Technical Indicators
Relative Strength Index (RSI): 28.62 (indicating an oversold condition)
Moving Average Convergence Divergence (MACD): -9.64 (suggesting bearish momentum)
5-Day Moving Average: ₹1,465.36
50-Day Moving Average: ₹1,490.21
200-Day Moving Average: ₹1,547.08
These indicators collectively suggest a bearish trend in the short term.
Piercing Line Bullish Pattern 🔎 Intro / Overview
The Piercing Line Pattern is a two-candle bullish reversal setup that forms after a downtrend.
- Sellers lose control → Buyers step in strongly.
- Entry and exit are rule-based using Validation and Devalidation lines to restrict false signals.
- Stop-loss is based on swing low, and Target is 1R (equal to risk distance).
This setup can be applied across any symbols and any timeframe (Just make sure it is after Downtrend or at Swing Low).
📊 Example symbols in this idea:
NSE:UPL · NSE:HAVELLS · NSE:COFORGE
___________________________________________________________
📌 How to Use
✅ Piercing Line Pattern – Confirmation Rules
1️⃣ Close Above Midpoint → The second candle must close above the midpoint of the first bearish candle.
2️⃣ Lower High Condition → The second candle’s high should be lower than the previous candle’s high, showing controlled recovery rather than immediate breakout.
3️⃣ Swing Low Context → The pattern forms after a swing low or decline, signaling potential reversal from bearish to bullish.
4️⃣ Gap/Open Condition → The second candle should open below the prior candle’s close, reflecting initial selling pressure before buyers take over.
When Pattern Confirm - Entry Rules -
📌 Validation → Close above the Pattern High .
📌 Devalidation → Close below Swing Low before validation.
When all conditions align, the Piercing Line confirms a bullish reversal opportunity.
__________________________________
🎯 Trading Plan
- Entry → Candle closes above the Validation line (Pattern high).
- Failure → If candle closes below Devalidation line before validation.
- Stoploss → Swing Low.
- Target → Equal to stoploss distance (1R).
___________________________________________________________
📊 Chart Explanation
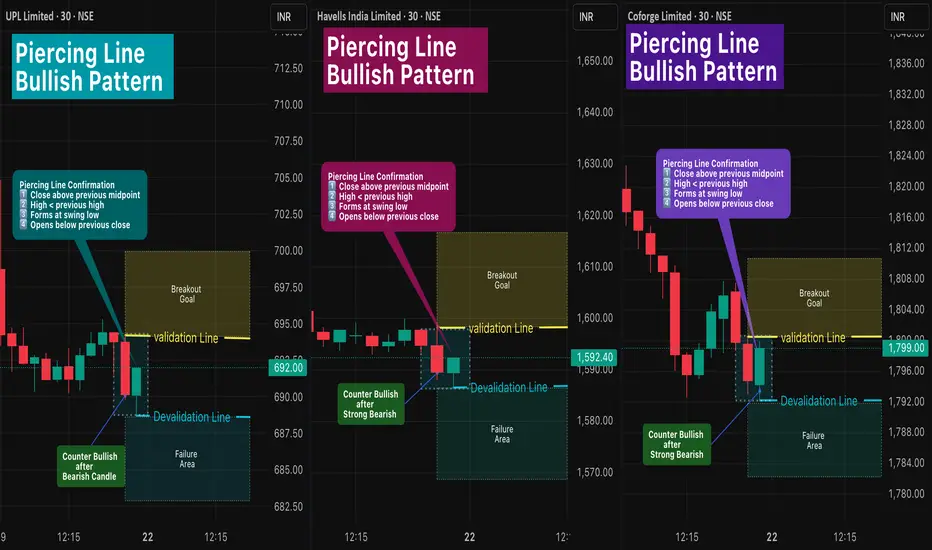
All Patterns shown in 30-min timeframe :
1️⃣ NSE:UPL (UPL Limited)
- Entry @ 694.20 → Breakout Goal confirmed only on candle close above this level.
- Devalidation Level: If price closes below 688.70 , the Pattern shifts to the Failure Area.
2️⃣ NSE:HAVELLS (Havells India Limited)
- Entry @ 1598.20 → Breakout Goal confirmed only on candle close above this level.
- Devalidation Level: If price closes below 1586.50 , the Pattern shifts to the Failure Area.
3️⃣ NSE:COFORGE (Coforge Limited)
- Entry @ 1800.50 → Breakout Goal confirmed only on candle close above this level.
- Devalidation Level: If price closes below 1792.10 , the Pattern shifts to the Failure Area. .
📊 All three Patterns are live and active in the same timeframe.
___________________________________________________________
👀 Observation
- Piercing Line is most effective near swing lows after a clear downtrend.
- Strict validation/devalidation rules help avoid false entries.
- Works well across multiple symbols when conditions align.
___________________________________________________________
❗ Why It Matters?
- Defines entries and exits clearly with rule-based validation.
- Provides a structured framework to trade reversals confidently.
___________________________________________________________
🎯 Conclusion
The Piercing Line Pattern is a disciplined bullish reversal signal.
By combining Validation and Devalidation Rules, traders gain clarity and protection against false trades.
🔥 Patterns don’t predict. Rules protect. 🚀
___________________________________________________________
⚠️ Disclaimer
📘 For educational purposes only.
🙅 Not SEBI registered.
❌ Not a buy/sell recommendation.
🧠 Purely a learning resource.
📊 Not Financial Advice.
Havells Bullish Flag Breakout: Can We See a Rally to 1680+?Havells India Ltd. is currently showing a classic bullish technical setup—a Bullish Flag Pattern—that could lead to a potential breakout and strong upside movement in the short term. Traders who favor breakout-based strategies should pay close attention to this chart, especially considering the structured parallel channel and previous rally that preceded it.
1. Bullish Flag Pattern: Anatomy of the Setup
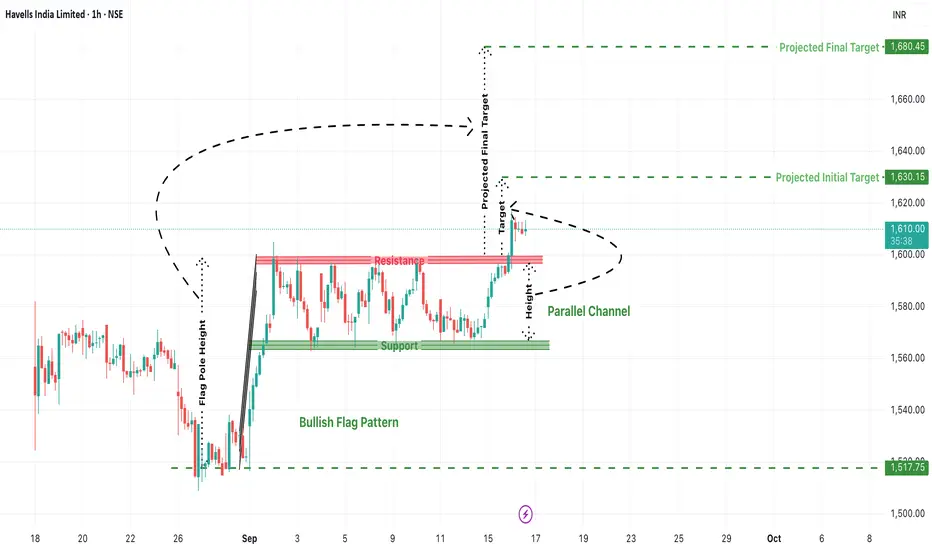
A bull flag is a continuation pattern that occurs after a sharp price rise (flagpole), followed by a period of consolidation within a narrow parallel channel (the flag). This structure typically suggests that the bullish trend will resume once the price breaks out of the flag range.
In Havells:
Flag Pole: The stock surged sharply from the 1517 zone to near 1610, forming a vertical rise.
Flag/Channel: Price moved sideways within a narrow support at ~1570 and resistance at ~1610, creating a clean parallel channel.
This shows price compression after a strong move, typically a sign of healthy consolidation before another leg up.
2. Breakout Levels and Price Action Confirmation
As per the current chart:
Havells has broken above the resistance zone around 1610, signaling a potential breakout.
The breakout candle is attempting to close above the red resistance band, and follow-up candles will be crucial to confirm strength.
A retest of this breakout zone could offer ideal long entries.
3. Projected Targets from the Pattern
Using the flagpole height, we can project upside targets from the breakout point:
Initial Target: ₹1630.15
A conservative target based on minor resistance and pole extension.
Final Projected Target: ₹1680.45
This marks the full measured move and could be achieved if the rally sustains momentum.
4. Ideal Trading Plan (For Traders)
Entry:
After confirmed breakout above ₹1610
Or on retest near ₹1600–1610 zone with bullish price action.
Stop Loss:
Below the flag support zone at around ₹1570
Aggressive traders can keep it below ₹1585.
Targets:
T1: ₹1630
T2: ₹1680+
Risk-Reward Ratio:
Minimum 1:2 depending on entry price.
5. Risk Scenarios to Watch For
False Breakouts: If the breakout doesn’t sustain and price falls back into the channel, it may trap early longs.
Macro Events: Broader market volatility (Nifty moves or global cues) can impact momentum.
Volume: Lack of volume on breakout candles can reduce conviction—always monitor volume to confirm strength.
Conclusion: Havells Looks Set for a Fresh Rally
This is a textbook bullish flag breakout in formation, with clear upside potential. If the momentum sustains, Havells could very well reach 1680+ in the coming sessions. However, traders must practice disciplined risk management, wait for confirmation, and avoid chasing without a proper plan.
Havells flag n poleHavells flag n pole breakout
Add alerts acc...
Proper consolidation for 2 to 3 phases
Simple Trend Analysis with BreakoutDisclaimer: This is just an a price action analysis of stock Tata Motors. Don't consider this as an stock tip or advice. Invest/Trade at your own risk.
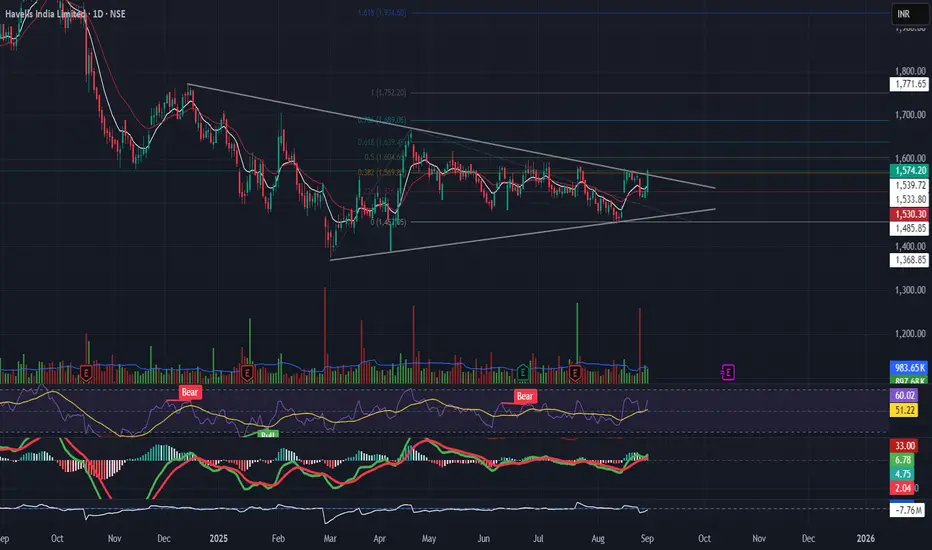
Havells breakout from symmetrical triangle patternHavells had Breakout from symmetrical triangle at the ₹1,570 descending resistance. RSI near 60, MACD recovering and moving up. Watch for volume-backed breakout.
Breakout above can fuel a move to ₹1,690–₹1,750.
Stop near ₹1,485.
🔌 Electrical sector needs confirmation for momentum entry."
HAVELLS - Weekly AnalysisIn the Weekly Chart of HAVELLS ,
we can see that, it has created a Hammer candle on support.
We can see a bounce back from here.
Expected momentum is shown in chart.
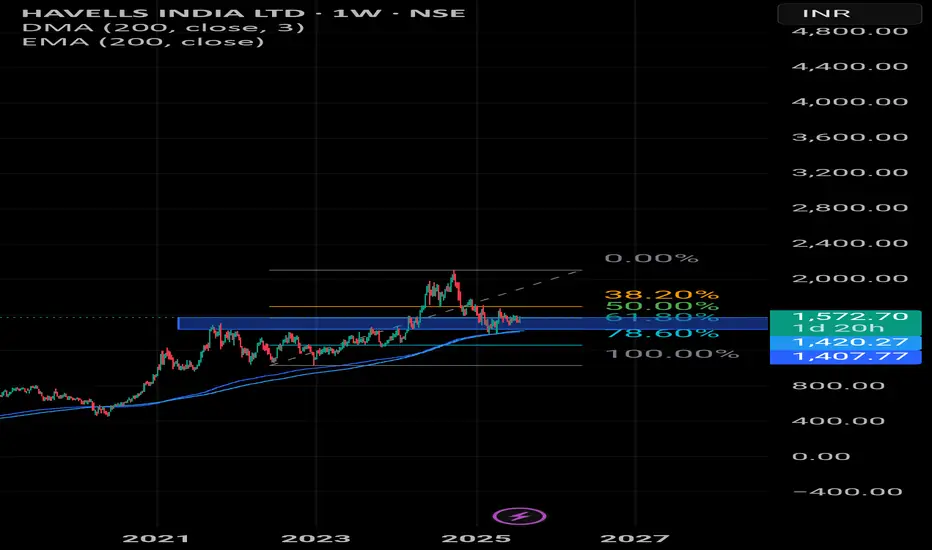
HAVELLS INDIA This stock is looking looking for reversal on weekly timeframe with Fibonacci retracment levels with Ema and dma of 200.
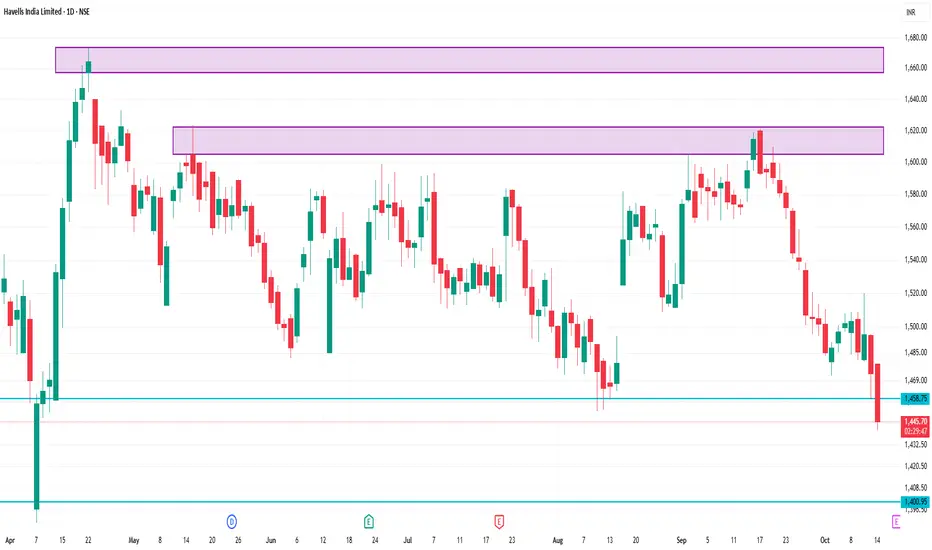
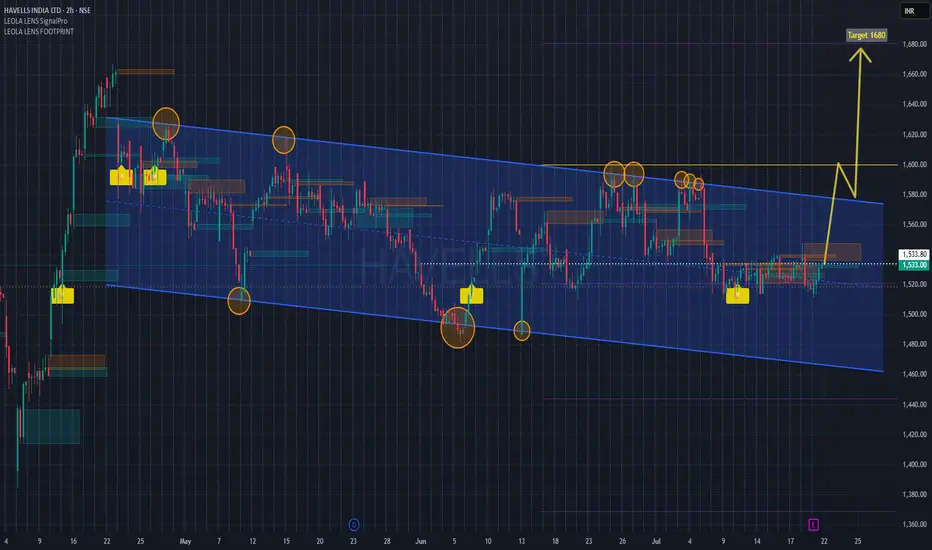
HAVELLS Channel Breakout Setup with Earnings Ahead Havells is approaching a crucial resistance trendline within a well-defined downward sloping channel. Price currently tests mid-channel and historical supply zones, with multiple Leola Lens SignalPro yellow caution labels plotted—historically seen before directional reversals.
📌 Structure Highlights:
Clear channel formation since April
Multiple resistance rejections near 1580 zone
Buy interest seen near lower boundary with SignalPro confirmation
Breakout projection suggests target zone near 1680, aligning with prior volume gap
📅 Earnings event likely to be a catalyst. Monitor price behavior post-results for potential breakout confirmation above 1580.
🧠 Leola Lens™ SignalPro Notes:
Yellow caution labels have repeatedly appeared near key turning points within the channel, suggesting possible trend transition zones. These zones highlight moments of institutional activity, where smart money behavior often shifts.
The yellow caution markers indicate potential trend change zones, based on historical conditions where price has shown institutional interest or liquidity shifts. These zones are not direct buy/sell signals, but highlight areas to monitor closely for structural confirmation.
🧠 This chart is intended for educational and structural analysis only. No financial advice.
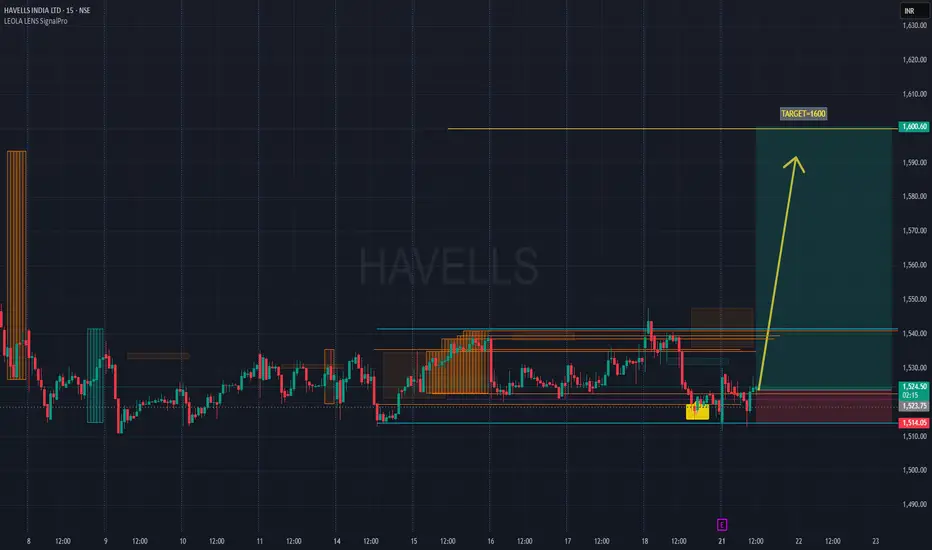
HAVELLS Pre-Result Reversal Watch I Holds for Potential 1600Chart Type: 15-minute | Tool Used: Leola Lens SignalPro
Price action has rebounded from a key liquidity zone (highlighted yellow) with visible accumulation below ₹1,520.
Key Observations:
Price retested prior demand zone (marked by SignalPro with structure and volume signals).
Potential bottom formation visible intraday with higher low attempt post 12 PM.
Rejection of downside wick near ₹1,514, aligning with earlier liquidity pockets.
Idea View:
If price sustains above ₹1,525–₹1,530, possible momentum expansion toward resistance zone at ₹1,600.60.
Clean structure break above previous order blocks may attract trend traders.
Result-based volatility expected — manage risk, especially with expected earnings post-market today.
Risk Reference Zone:
Invalid below ₹1,510 (red shaded zone)
This is not financial advice. Chart is for educational and structural reference only.
#HAVELLS #PriceAction #ChartAnalysis #MarketStructure #SignalPro #LiquidityZones #TechnicalAnalysis #TrendReversal #NSEStocks #EarningsSetup
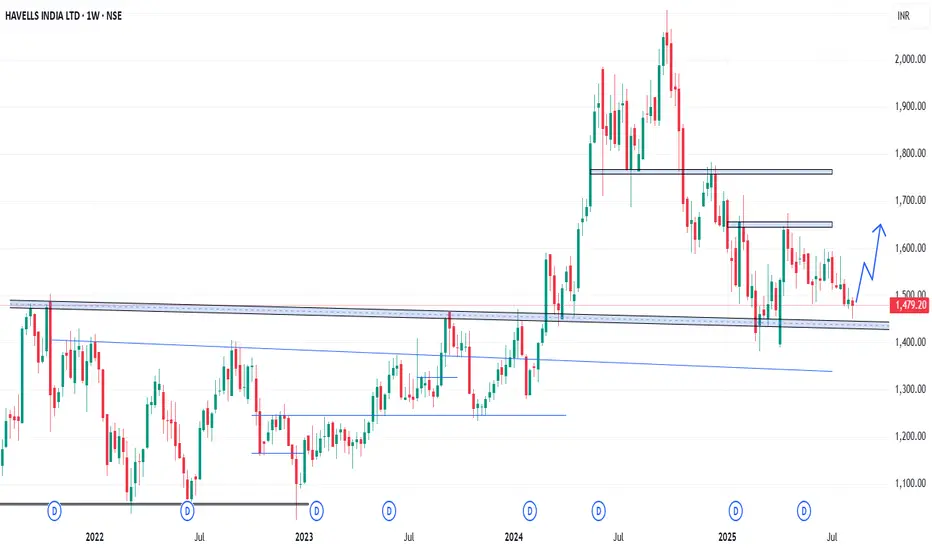
Havells India Shows Early Bullish Signs After Strong Support at Topic Statement:
Havells India has corrected but is showing early bullish signals, supported by key technical levels and poised for a breakout from its short-term downtrend.
Key Points:
* The price corrected to the 38.2% Fibonacci retracement level, where it received strong support
* It touched the 200-day EMA, which acted as a deflection point, preventing further downside
* Currently moving in a short-term downtrending channel, the stock is likely to resume strong bullish momentum once it breaks above this channel
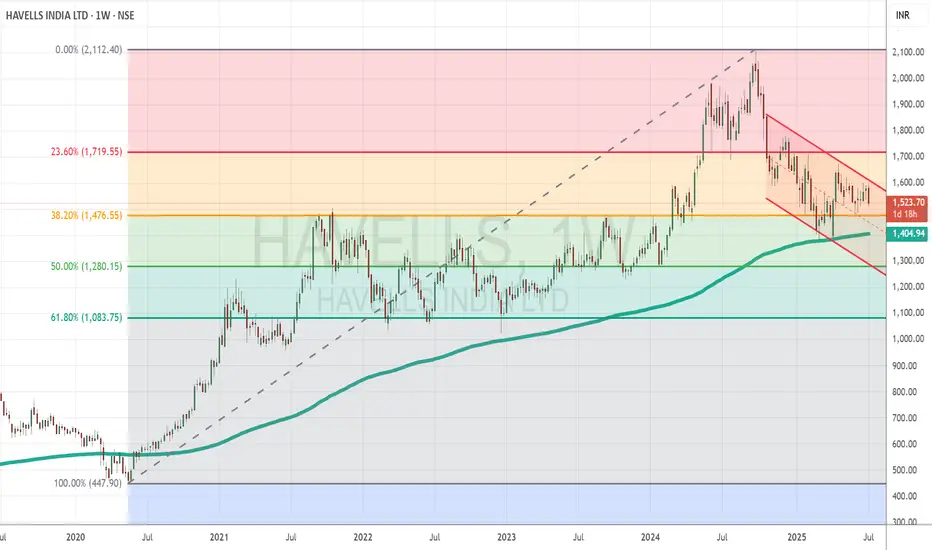
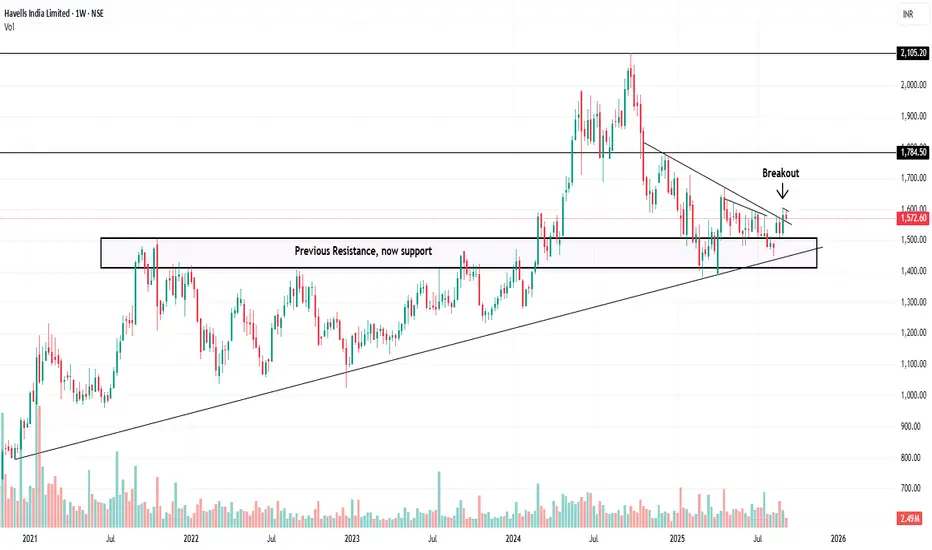
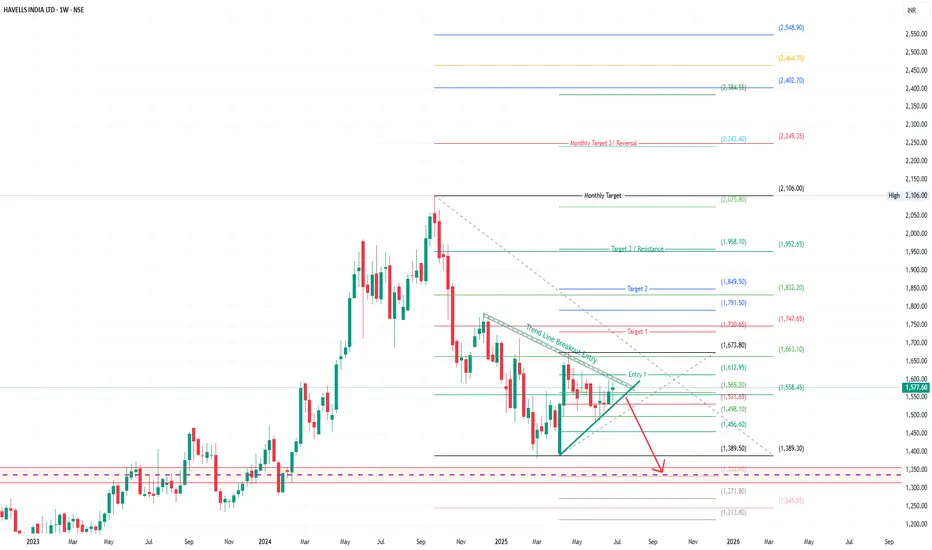
Havells Weekly Breakout Setup | Targets ₹2,548+ After Trendline Havells India is showing signs of a falling wedge breakout on the weekly chart, a bullish reversal pattern often followed by sharp upside movement. The breakout appears near ₹1,565–1,612 zone, supported by a trendline breach and base formation.
This setup indicates strength if price sustains above the entry zone, with Fibonacci extensions pointing toward higher targets.
Key Technical Observations:
Pattern: Falling Wedge
Breakout Zone: ₹1,565–1,612
Monthly Target: ₹2,106
Volume: Increasing near breakout, adding credibility
Risk: Pullback toward ₹1,500 if resistance fails
Target Levels (Fibonacci Projections):
Target 1: ₹1,674
Target 2: ₹1,850
Target 3: ₹1,958
Monthly Target: ₹2,106
Extended Targets: ₹2,384 to ₹2,548
Invalidation Zone:
If price falls below ₹1,498 and breaks the wedge support again, the setup weakens.
Bearish Case: Breakdown may lead to ₹1,271 or even ₹1,213 in extreme cases.
Conclusion:
Watch for candle closing above ₹1,612 with volume confirmation. The trendline breakout setup offers a potential multi-leg rally if it sustains.
Disclaimer:
This technical analysis is for educational purposes only. Please consult a registered financial advisor before making investment decisions.
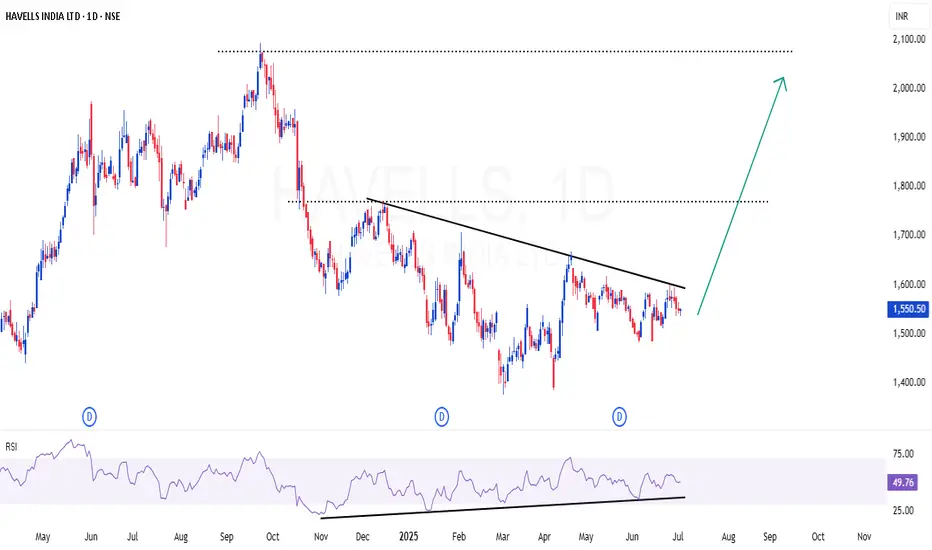
HAVELLS | Pleasant set up - INHS & RSI divergenceHAVELLS | Pleasant set up - INHS & RSI divergence
Strong RSI divergence in daily time frame
Inverted Head & Shoulder setup also in visual
A small dip may be possible for 8-10% in this stock , as market (NIFTY) is over heated. But we can consider that as opportunity to scale up the position
CMP : 1550 (Dip : 1480)
havells indiahavells good price zone reason volume and median pe low and result is good
pe 66 mpe 70 lpe 63 25 feb 2025
roe 18
roce 26

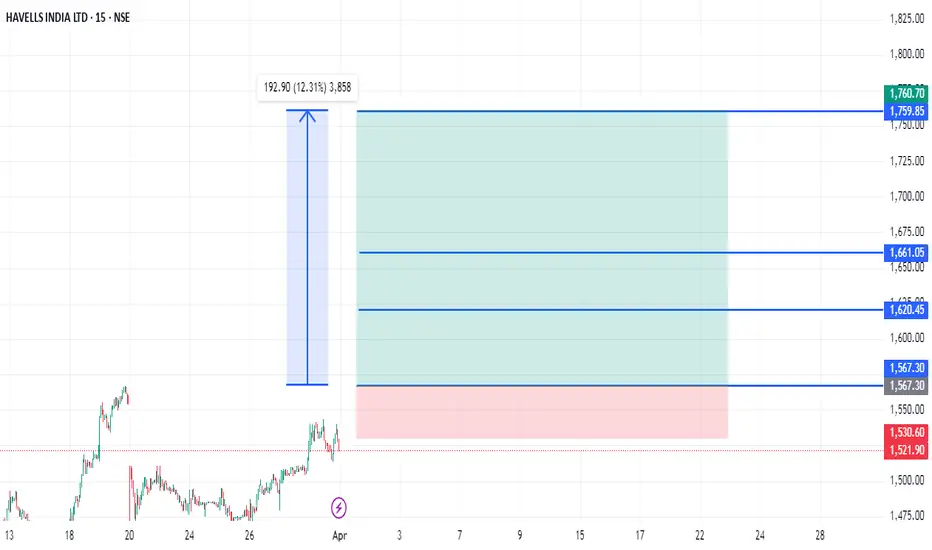
HAVELLS STRONG READY TO FLY 193 POINTS Havells strong zone above only 1567
Short term buy zone
Wait for Active
Buy above 1567
Stoploss.......1530....37 points
Target1.........1620...53 points
Target2.........1660...93 points
Target3.........1760...193 points
Disclaimer- This level only educational purpose and paper trade only. Do ur own analysis
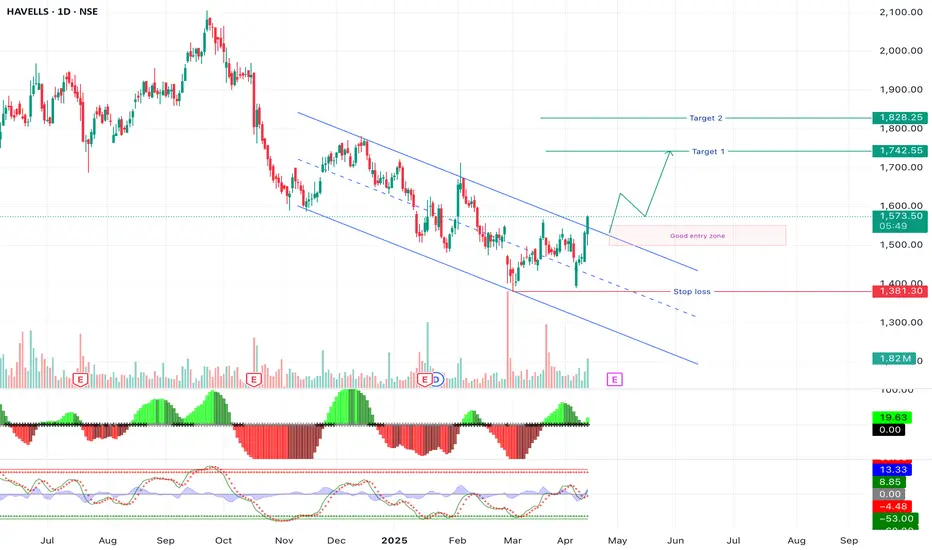
Havells Long l Swing Moving out of channel
Volume greater than average volume
Making higher high, change of character
Can wait for some reversal for better risk rewards
Targets and SL as given in the chart
HAVELLS DOUBLE BOTTOM REVERSALHavells breaking double bottom reversal
with good volume building up
bullish rsi,macd crossover done
#resistance at 1670-1700
NO BUY SELL RECOMENDATION

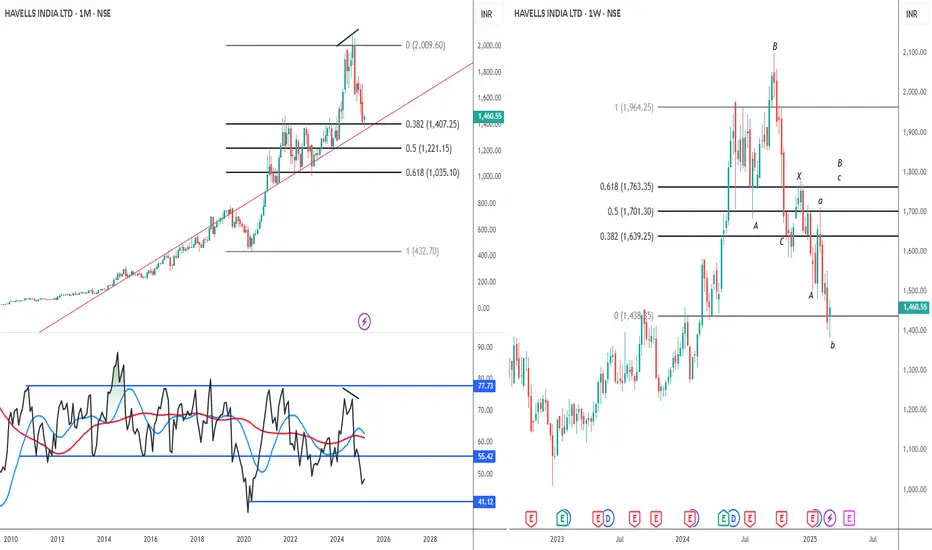
It is just a rally !!Havells CMP 1460
Trendline- the long term trendline is intact. But this is not the only tool used to gauge the trend. Yes it is still in the safe zone.
Fib - the support at 38.2% is strength. But will it hold ??
RSI - mind u this is a monthly chart and we have a strong negative divergence. Which is a sign of reversal
Elliott- The stock is exhibiting a complex corrective pattern. Which means the correction is not over. This rally should go to 1760, since in the real world nothing is perfect we will take 1700 as our tgt.
Conclusion - this is c of B. Hence expect a sharp rally from here. But do not forget to exit.

Havells: Testing Key Support Levels Amid Market CorrectionTopic Statement:
Havells has corrected along with the broader market and is now approaching critical support levels that may determine its next move.
Key points:
1. The price is taking heavy support at the 38.2% retracement level at 1,476.
2. The stock is trading close to the 180-day moving average.
3. Weekly RSI is at 40, indicating the stock is nearing oversold territory.
4. If the support at 1,476 fails, the price may decline further to the 50% retracement level at 1,280.

Double Bottom- HavellsWhat Is a Double Bottom?
A double bottom pattern is a classic technical analysis charting formation that represents a major change in trend and a momentum reversal from a prior down move in market trading. It describes the drop of a security or index, a rebound, another drop to the same or similar level as the original drop, and finally another rebound (that may become a new uptrend). The double bottom looks like the letter "W." The twice-touched low is now considered a significant support level. While those two lows hold, the upside has new potential.
In terms of profit targets, a conservative reading of the pattern suggests the minimum-move price target is equal to the distance of the two lows and the intermediate high. More aggressive targets are double the distance between the two lows and the intermediate high.
