Havells India Cmp 1270 dated 12-10-2022 HAMMER CANDLEHavells India Cmp 1270 dated 12-10-2022
Swing Trade
1. Hammer Candle @ support
Buy above 1286 for target 1310-1330-1350-1365
1375-1390-1405 SL 1245
Disclaimer :
I am not a Sebi registered Analyst so please do your own Analysis before taking any action.
The above view is shared just for educational purpose.
By no means shall be responsible for any losses amounting out of it incase if any trades on it.
It is just a view, pls trade at your own risk.
Trade ideas

HavellsHavells is forming inverse head and shoulder pattern after the fall. This may be good oppurtunity for near term upside move

After 1429 , if it is a good break out , It will reach....After 1429 , if it is a good break out , It will reach first target 1478
Reason to choose the company
Debt is low .
Mutual funds are increasing their holding .
May be in a month , the break out may happen.

Havells is different !!Havells has broken out of a flag with pattern after taking support from the 50ema, Although markets are bearish right now, nifty rests on its 200ema and we may see a bounce back throughout these bearish days where most stocks broke structure and fell sharply, havells maintained and consolidated on
its moving average showing strength
Target: Flags High


HAVELLS- Short Term :Bulls Counter attackHAVELLS- Short Term :Bulls Counter attack , up trend as long as it sustains above 1330 on closing basis. Potential targets - 1497

I Love This Setup... Breakout + Retest + Above 50 EMA... Wait For Buy Signal Or Trigger... Good Opportunity For Swing Trader..
Tip: I Am Not A Sebi Registered Plz Trade Or Invest On You're Own Risk..
Happy Trading...😍

[Positional] HAVELLS Double Bottom BreakoutHavells has formed a nice double bottom.Today it has come out of Double bottom pattern also it has broken the resistance zone- so higher levels are expected going forward.
The length of bottom is quite high - and it exceeds the ATH of HAVELLS if projected upwards - so our R:R will be low in this case.
Entry - 1348-1350
Target - 1486
SL - 1200
Though R:R is very low - Probability of profit is high.

Bearish flag pattern breakout in HAVELLS.Discription:
Stock Name: HAVELLS
Chart Pattern: Bearish flag pattern breakout
Time Frame: 1 D
Entry: Breakout entry above 1380+
Breakout target : 1834+

HAVELLS August positionalHavells is preparing for a range breakout with head and shoulder confluence. Wait for retest after breakout. Mark the levels

Havells India Ltd (HVEL)@breakout
Havells India Ltd (HVEL)@breakout
Havells India Ltd (HVEL) strong breakout with volume break out and momemtum created in day chart.
Havells breakout for long. so strong upside are coming. BUY above 1390
NEXT TARGET 1417,1432,1468. Time to go for long, get ready to catch the profit. Thank you.

IS HAVELLS HEADING TOWARDS 1630?Havells has given a breakout of double bottom pattern and we expect to see 1600 - 1630 levels in coming months.
To motivate us, Please like the idea If you agree with the analysis.
Happy Trading!
InvestPro India Team

Havells day chart analysisINVERSE HEAD& SHOULDER pattern breakout+ trend line breakout from upside...

havells long term viewHavells for long-term positional view. already done flag breakout as well trendy stock

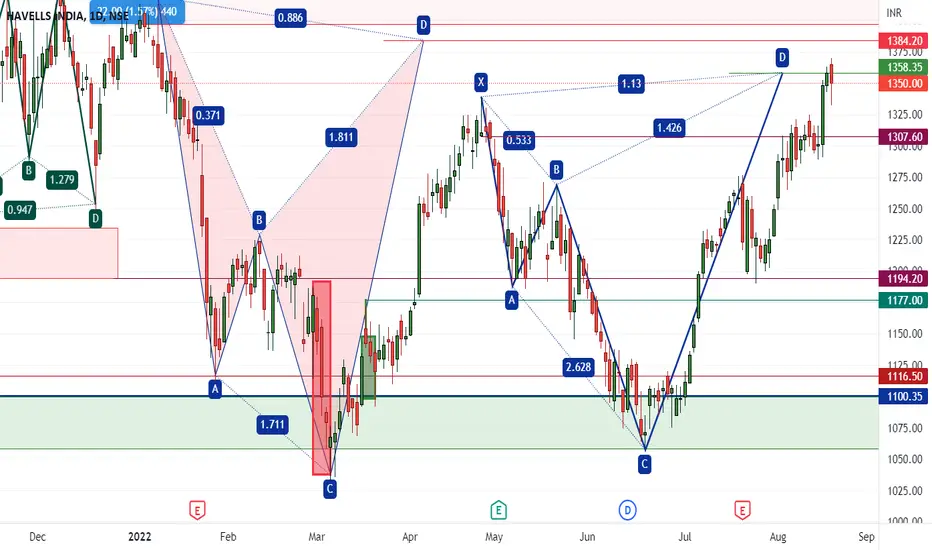
#Havells Harmonic update#Havells Harmonic worked perfectly
it's now near to profit
Booking zone- 1307.60
CMP:1350 @21 Aug 2022
BOS CHOCH Trend Change Identification Trend change identification using SMC which works at the best irrespective of the support and resistance/ breakout/ trendline/ patterns.

Breakout in HAVELLSBreakout in HAVELLS
Entry: CMP
Targets: 1420 & 1480
DISCLAIMER: The ideas shared are only for educational purpose. The markets are very volatile, so plan your trades accordingly. Please trade with stop loss (SL FOR THIS SETUP IS HUGE. PLEASE PLAN YOUR TRADES). I am not SEBI registered.

Double Bottom pattern in HAVELLSDiscription:
Stock Name: HAVELLS
Chart Pattern: Double bottom pattern
Time Frame: 1W
Breakout Entry above : 1350+
Breakout target : 1640+

HAVELLSHavells has given a falling channel breakout and retest has also completed, it has also formed an inverted H&S pattern and neck line break and retest has also happened ....

HABELLS - Trend Line Break - Go Long (Swing Trade)HAVELLS INDIA - is breaking upper trend line in Daily time frame and consolidating for its Bullish move. We can go long at trendline retracement.
Buy now @ 1275-1280
Stop Loss = 1190
Target = 1415 / 1500
Thanks!

Hop On the Havells trainHavells has formed a beautiful bullish rejection candle on the 50 and 200EMA on above average volume and opens a possibility for a long trade
Has a favourable risk to reward ratio
Traget: 1317
Stop loss: Tight below the rejection candle and 50EMA
Keep It Simple

#Havells #Head&Shoulder #patterns #insidebar#Havells Head&Shoulder patterns + insidebar in last 3 days candle Wait & Watch.

Havells Breakout on Weekly TimeframeHavells Looks really good here at CMP 1289. The stock has broken out from falling trendline. It can be added at CMP 1289 and in dips below till 1250 with a stop loss below 1225 for targets of 1340/1400/1450/1520.
