Trade ideas


A rounding bottom THe stock is on daily resistance testing this resistance 3 rd time if this breaks strong momentum might be there if it stays near resistance then the probability is good to breakout

Havells W After M, Rare!AS drawn in chart, enter after 1099 only will make sense and may take short term to reach the target but business is going good may see good growth over all, this just idea , .follow for more genuine ideas on standard stocks only...


Havells Long term support breakoutHavells has done a breakout from a long term support after several month consolidation

Buy HAVELLSAccording to chart anylasis its given channel breakout and closed above upper trandline.
Buy : 1080
Target : 1100-1138-1150++

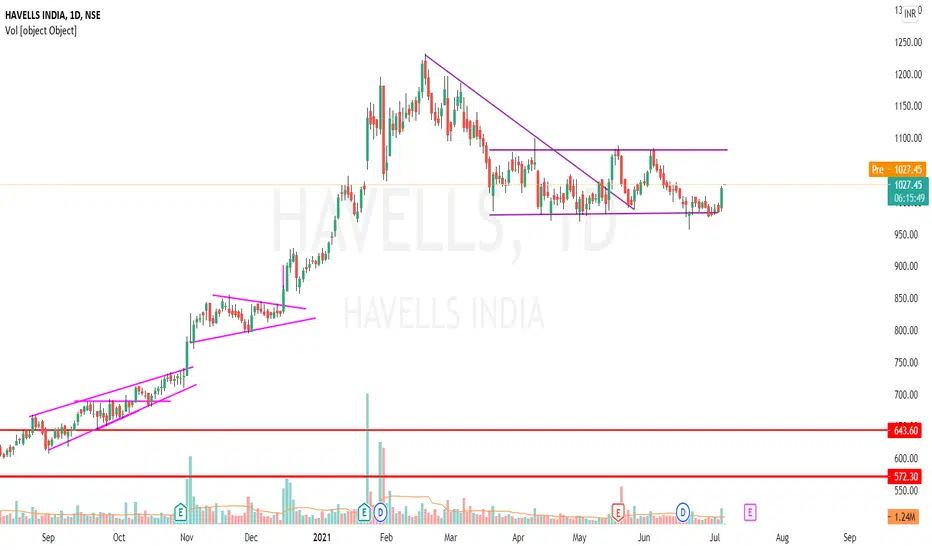
Havells - Box pattern breakoutPrice after a big bull run trades sideways and now its all set to break the box pattern. Wait for the break and trade.

HAVELLSPrice Consolidated long time from the last 3-4 months.
Trendline breakout and retested.
Can Go Long for big targets.

What is a Stage 2 Mark-up and why it is liked by swing traders?Great setup being formed as the stage 1 accumulation seems about to end. Thus, stock is ready to enter the favourate phase of every trend following trader i.e. Stage 2 Mark-up period.
Now,
What is a mark-up period?
Here, a stock exits a phase of accumulation where smart money accumulates a large chunk of share from the market and picking all the offers made by the sellers. Thus, sucking the liquidity and at this point, a simple maket order will take all the shares from the sellers accending the price upwards. Here all the short sellers are trappeded, therefore, making the stock a good candidate for sidelined cash to enter.


Trendline breakout and retested Trendline breakout and retested also 3 times the upper resistance worked and this time it will be broken with huge 8% move


Keep on radar. Havells trend breakout.Descending Trendline break out.
Have taken support on 62% retracement.


Breakout in HavellsA Triangle pattern with a respected trendline and a higly support zone.Good Beakout and Retest of a triangle pattern is seen in Havells daily Chart.Go for long position with pivot levels as target.


3 Targets hit in Havells today. New Targets for HavellsNSE:HAVELLS
Today, 16-07-2021, it hit our all 3 targets. Even made day high at target -4 which was not mentioned before. And Today it closed above our 3rd Target. this will act as good support zone. Don't take buy trade if the stock is trading below this range.
You can only take fresh buy trade above 1076 only.
And once it breaks the 1100 resistance then there will be long rally upside for few days to reach up to 1200 easily. And one can take positional trade.
All the best for trading in next week.

Havells: Looks good for +1200Havells if it breaks current level suscessfully then we can see +1200 in this
