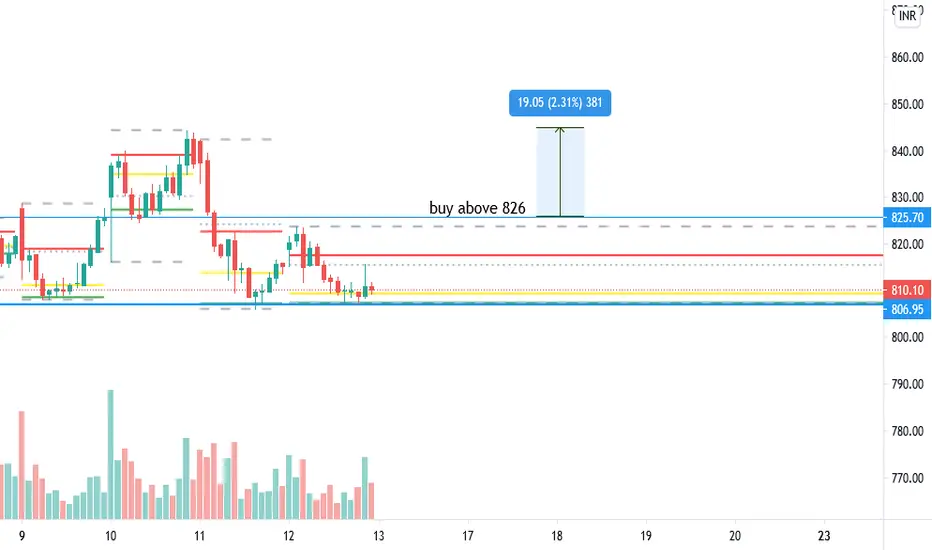
Range Breakout after consolidation.A range breakout has happened after few days of consolidation. Should show some positive results in few days.
Disclaimer:
The information provided here is for educational & instructive purposes only. Our intention is not to provide any financial advice, investment advice, training advice or any other advice. This is general information and is not explicit to you or anyone else.
Please do your own research and consult with your financial adviser before investing or trading. We will not be responsible for any profit or loss.
Trade ideas


If you like my calls then , would request you to open your dematIf you like my calls then , would request you to open your demat from the below link. (It wont take much time)
Adding to the advantages from Upstox, I will be providing time to time educational ideas on stocks on my Trading view account platform please like & follow me their for further updates
To Open Account: upstox.com
Like & Follow me on
My Trading view : in.tradingview.com
For creating login ID on Trading view use the below link
in.tradingview.com

HAVELLS - TRIANGLE PATTERN - SWING TRADEMy view is that the stock will move up from here since it as the bottom of the pattern. It may not sustain if broken because the build up is not yet formed.
Note:
Avoid the stock if a big gap up or gap down is seen
Enter after the breakout happens and not before it
Do not chase the market, i.e., do not get involved in late entries
Only enter with strict stop-loss and target
This is not a recommendation and is for educational purposes only.
always follow risk-reward and quantity management for the 100% of the times
The above mentioned idea may not work, so beware of the risk you are taking
Follow me to Learn and Earn with me.
Happy Trading!!


Pennant pattern in HavellsPennant pattern in Havells. Wait for breakout and take entry.
Disclaimer: All charts are purely for educational and information purpose only. Invest or Trade at your own risk.

Havells - Inverted bullish hammer at supportNote: This is for educational purpose only.
There seems to be an inverted bullish hammer on 21 EMA which has acted as dynamic support before as well. RSI is 60 which indicates bullish momentum.


HAVELLS FLAG PATTERN 1HRTHE STOCK HAS GIVEN A BREKOUT OF A FLAG PATTERN ON HOURLY CHART
AND HAS CLOSED ABOVE IT
TARGET ARE 845 AND 853 INTRADAY
SL 825


Havells to fire!After a decent consolidation, Havells looks good for a BO. One can go long above 839 and expect it to test 850+ levels for a new ATH.


DAILY SWING CALL // Thursday 3rd of December 2020 // HAVELLSDAILY SWING CALL // Thursday 3rd of December 2020 // NSE:HAVELLS
// This is a swing trade call and not an intra-day trade. Please do not expect the stock to go up on the same day of posting or within a few sessions. Please follow the notes along with the posting before, during and after entering the trade //
CMP / LTP: 836.35
TARGET: 962+ (15%)
STOP LOSS: 752(10 % Max)
DURATION: In 15-20 Trading Sessions Target should be achieved
FOR STANDARD NOTES / DISC: Please refer my earlier posts on Tradingview.com

#HAVELLS FOR 850/900A GOOD RETEST AFTER A BURST MOVE IN IT, MIGHT SPEND SOME MORE TIME SO BETTER TO KEEP A CLOSING BASIS SL OF 795 ZONE A VERY GOOD RR OF 1:10 RISK - 10, REWARD 50/60

Havells4H. Has broken out already at it all time high. Indicators positive. Will corect a bit and rally up.

SHORT IDEA ON HAVELLSTEMPORARY TREND SEEMS TO BE WEAK IN HAVELLS CAN GO SHORT BELOW 798 FOR A TARGET OF 783 IN SHORT TERM.
NOTE:JUST AVIEW TRADE AT YOUR OWN RISK

Havells - trading at important resistance - looks bearish Havells - made a pole and upflag pattern but back at resistance and looks weak below current price

HAVELLS - Long TradePA suggests a long in NSE:HAVELLS for a decent trade. All details in the chart.
One can trade in cash or Futures. Try to enter with price on arrival on lower time frames to keep the risk absolute minimum.
All the best Y'all!!


Havells 1D chartlong term resistance broken, retesting going on. Please enter the trade once u get a proper breakout or reversal from the levels, Do not hesitate to contact me with any queries. Kindly support my views. Thanks