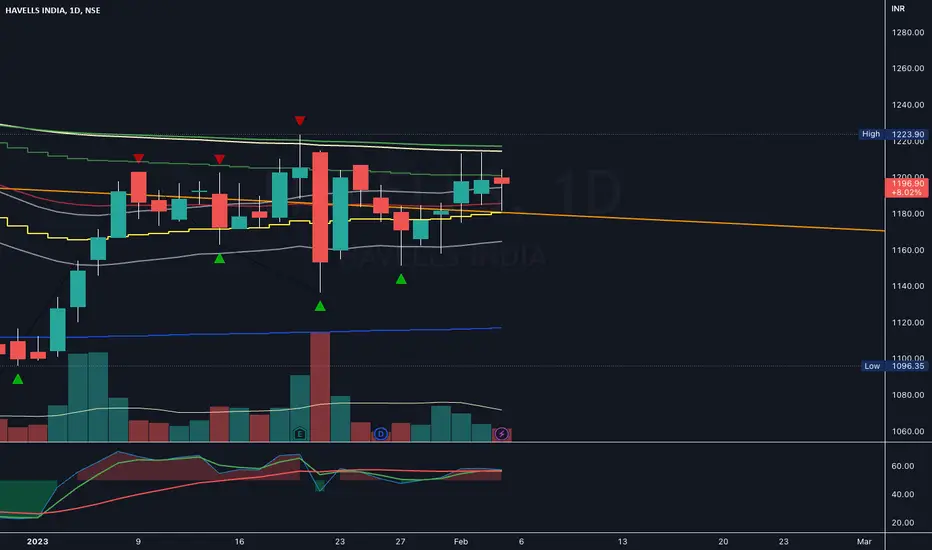
intraday / RSI Divergencersi is dropping but the price of stock wasn't droping
both side potential
avoid first 15min breakout
wait for 15 min candle closing
targets are marked
if the breakout comes after 10:00 am then the probability of winning will be more.
follow risk management
do your own analysis
do workout
do meditation
start reading books
Trade ideas

intradayavoid first 15min breakout
wait for 15 min candle closing
targets are marked
if the breakout comes after 10:00 am then the probability of winning will be more.
follow risk management
do your own analysis
do workout
do meditation
start reading books

intradaybearish RSI Divergence
Both side potential
avoid first 15min breakout
wait for 15 min candle closing
targets are marked
if the breakout comes after 10:00 am then the probability of winning will be more.
follow risk management
do your own analysis
do workout
do meditation
start reading books

Inverted head and shoulder pattern in HAVELLSHAVELLS
Key highlights: 💡⚡
✅On 1D Time Frame Stock Showing Breakout of Inverted head and shoulder Pattern .
✅ Strong Bullsih Candlestick Form on this timeframe.
✅It can give movement up to the Breakout target of 1440+.
✅Can Go short in this stock by placing a stop loss below 1177-.
✅breakout this can give risk:reward upto 1:5+.

Symmetrical Triangle#HAVELLS Weekly
- Symmetrical Triangle
- BO in progress in Weekly but Done is Daily tf
Negetive :-
-Volume is missing.

HAVELLSHAVELLS:- Ascending triangle pattern has been formed, the stock has given a breakout, but waiting for retesting. If you are planning something, keep an eye on it.
Hello traders,
As always, simple and neat charts so everyone can understand and not make it too complicated.
rest details mentioned in the chart.
will be posting more such ideas like this. Until that, like share and follow :)
check my other ideas to get to know about all the successful trades based on price action.
Thanks,
Ajay.
keep learning and keep earning.


TRIANGLE PATTERN IN HAVELLSGood move possible above 1220 with swing tgt 1260-65.
just for educational purpose.

Havells looks really good for a long trade summer is coming...We all know that from next month summer is coming and the companies like havells is dominating the indian market in the sales of fans, AC.. and other electrical equipment.
havells looks really good on the chart it bounced from the daily demand but hit the stoploss and now it is trying to cross the trendline liquidity from the demand bounce looks good on the chart so my view is to go long on this.


intradaytake entry after 10 am
wait for the entry . important zones are marked
follow risk management and control your emotions

On a long term trendlineHAVELLS is near a 18 year old trend line on a monthly char and on a log chart. Overall it has been consolidating in the range of 980-1275 for 2 years. Hence when it breaks or bounces from trendline, both will start a new strong trend.

Symmetrical triangle pattern reversal in HAVELLSHAVELLS
Key highlights: 💡⚡
✅On 1W Time Frame Stock Showing Reversal of Symmetrical triangle Pattern.
✅ It can give movement upto the Reversal target of above 1340+.
✅ Can Go Short in this stock by placing stop loss Above 1080 or last swing low.

Falling wedge pattern reversal in HAVELLSHAVELLS
Key highlights: 💡⚡
📊On 1D Time Frame Stock Showing Reversal of Falling wedge Pattern .
📊 It can give movement upto the Reversal target of above 1235+.
📊There have chances of breakout of Resistance level too.
📊 After breakout of Resistance level this stock can gives strong upside rally upto above 1400+


HAVELLS LONGHAVELLS LTD is looking strong upside.
You can go for it after doing your own analysis.
entry price target and stop loss has been updated in the chart.


ReReversal Trade
Positional Trade in Emami trend. Just my analysis for my trade.No recommendation. Looking to buy Emami for 1:4 TRADE.

HAVELLS INDIA idea for intradayIntraday Trade
if HAVELLS INDIA breaks 1244 or closes 5 min candle then buy T1-1255/1260
If breaks below 1229 then sell for T1-1220/1210
