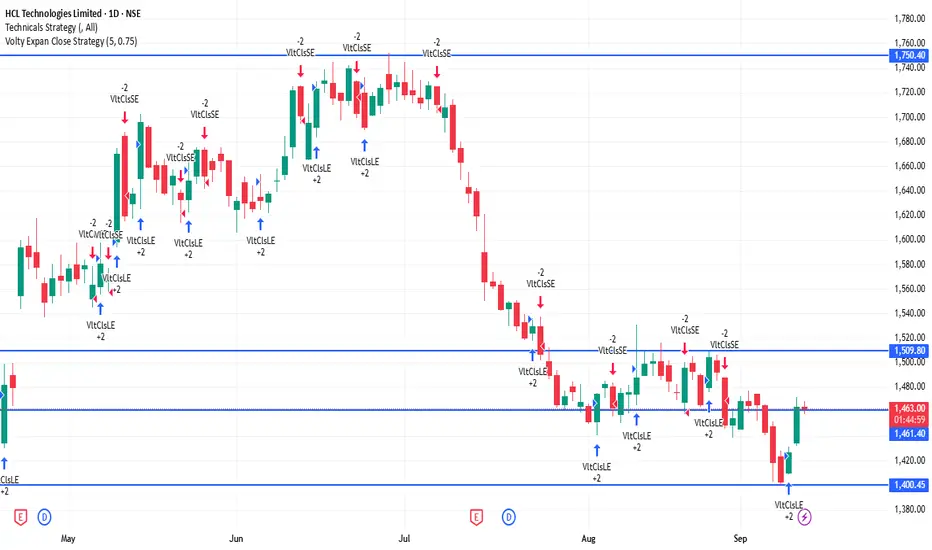
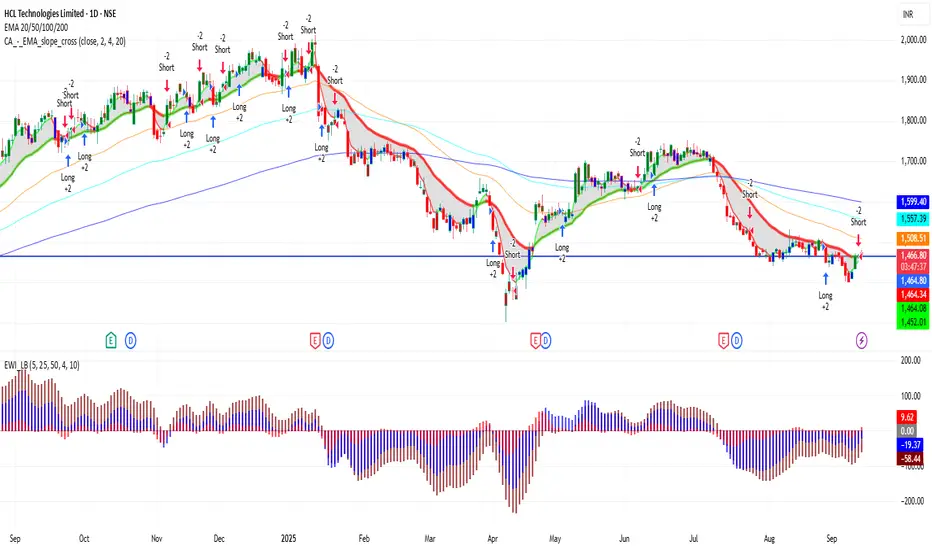
HCLTECH 1D Time frame📊 Current Overview
Price is trading near ₹1,460 – ₹1,470 range.
Trend on the daily chart is showing weakness.
Stock is trading below most key moving averages (50-day, 100-day, 200-day).
🔍 Support & Resistance
Immediate Support: ₹1,450
Next Support: ₹1,430 – ₹1,420
Immediate Resistance: ₹1,470 – ₹1,475
Higher Resistance: ₹1,490 – ₹1,500
📈 Indicators
RSI (14): Neutral to slightly bearish, around mid-40s.
MACD: Weak, showing bearish crossover or flat momentum.
Trend: More sideways to bearish unless resistance levels break.
🎯 Possible Scenarios
Bullish: If HCLTECH breaks and sustains above ₹1,475, it could target ₹1,490 – ₹1,500.
Bearish: If it fails and slips below ₹1,450, it may fall towards ₹1,430 – ₹1,420.
HCLTECH trade ideas
HCLTECH 1D Time frameCurrent Picture
Share price is ~ ₹1,499-₹1,505.
Recent momentum has been upward; the stock is trading above most moving averages—short-, medium-, and long-term.
Indicators are generally favoring continuation of the uptrend.
⚙️ Indicators / Momentum
Many oscillators (RSI, MACD, CCI etc.) are in bullish territory.
Moving averages from 5-, 10-, 20-, 50-, 100- to 200‐day are all aligned bullish (price above them).
Volatility is moderate to high — good movement, but also risk of pullbacks.
📌 Key Support & Resistance Levels
Immediate Resistance: around ₹1,505-₹1,515.
Immediate Support: near ₹1,480-₹1,490.
Stronger support further down around ₹1,400-₹1,420 in case of sharper correction.
✅ Outlook & Risks
Short term bias is bullish as long as price holds above the immediate support (≈ ₹1,480).
If resistance around ₹1,510 breaks decisively, more upside is likely.
HCLTECH 1D Time frameUpdated Snapshot
Current Price: ₹1,466
Day’s Range: ₹1,452 – ₹1,467
Previous Close: ₹1,467.20
🔹 Support & Resistance
Support 1: ₹1,452 – ₹1,450
Support 2: ₹1,430 – ₹1,420
Resistance 1: ₹1,470 – ₹1,475
Resistance 2: ₹1,490 – ₹1,500
HCLTECH 1D Time frame📍 Current Price Action
HCLTECH is trading around ₹1,464.
Day’s low is near ₹1,458, and high is around ₹1,470.
The stock is consolidating near the upper end of its intraday range.
⚖️ Key Levels
Immediate Resistance: ₹1,470 – ₹1,475
Next Resistance: ₹1,495 – ₹1,500
Immediate Support: ₹1,450
Strong Support: ₹1,430 – ₹1,420
📊 Indicators
Moving Averages: Short-term MAs (5-, 10-day) slightly lagging, medium-term (20-, 50-day) supportive → trend mildly bullish.
RSI (14-day): Around 66 → showing bullish momentum, approaching overbought.
MACD: Positive, indicating mild bullish bias, but momentum is not extremely strong.
📈 Outlook
If HCLTECH holds above ₹1,450, potential upside toward ₹1,470 – ₹1,495 exists.
A breakout above ₹1,475 could open room toward ₹1,500.
On the downside, a drop below ₹1,450 may test ₹1,430 – ₹1,420 support.
Overall bias: Slightly bullish, but caution near resistance.
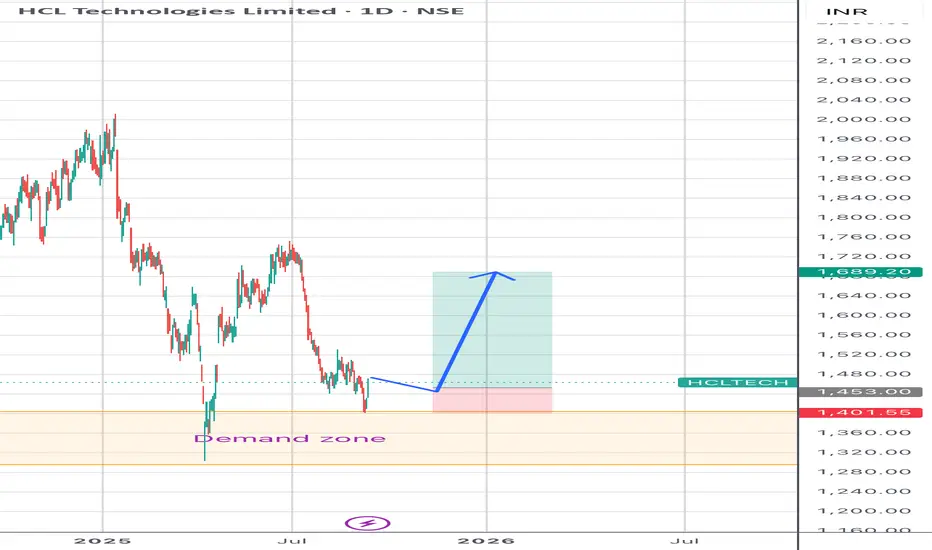
HCL technology target 1689.2Daily demand area touched and shown good support from the investors. Looks like next target is 1689.2 and stop loss 1400.0
HCLTECH 1D Time frame📉 Current Market Snapshot
Current Price: ₹1,467
Previous Close: ₹1,467.20
Day’s Range: ₹1,463 – ₹1,480
📊 Key Support & Resistance Levels
Support Levels: ₹1,463, ₹1,450
Resistance Levels: ₹1,480, ₹1,500
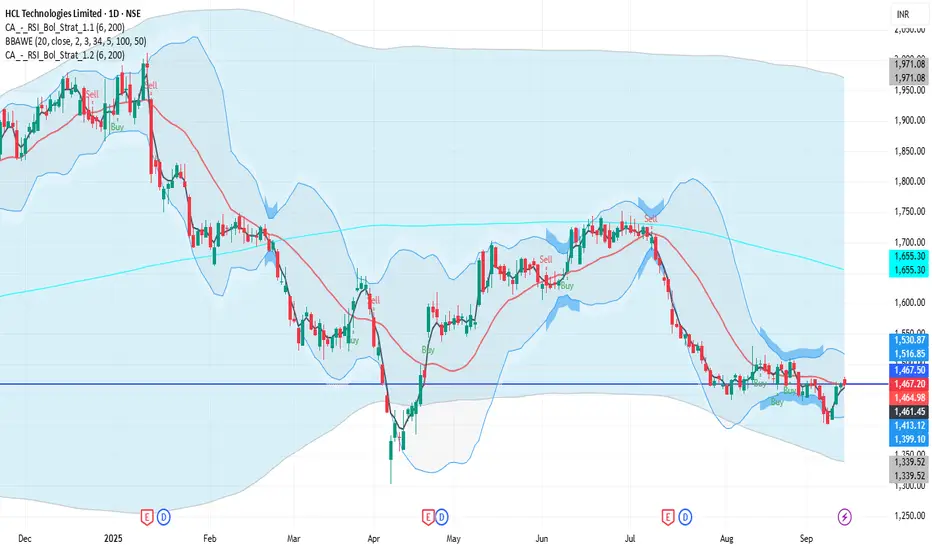
HCLTECH 1D Time frame🔢 Current Level
Trading around ₹1,465.80 - ₹1,467.80
🔑 Key Resistance & Support Levels
Resistance Zones:
₹1,472 – ₹1,475 (recent highs; breakout above this may lead to further upside)
₹1,485 – ₹1,490 (stronger resistance above)
Support Zones:
₹1,460 – ₹1,463 (immediate support; failure to hold above this may lead to a decline)
₹1,450 – ₹1,453 (short-term support; a break below this could indicate weakness)
₹1,440 – ₹1,445 (deeper support zone if price dips further)
📉 Outlook
Bullish Scenario: If HCL Technologies holds above ₹1,463, upward momentum may continue. Break above ₹1,475 can open the way toward ₹1,485+.
Bearish Scenario: If it falls below ₹1,440, risk increases toward ₹1,430 – ₹1,445.
Neutral / Range: Between ₹1,463 – ₹1,475, HCL Technologies may consolidate before a directional move.
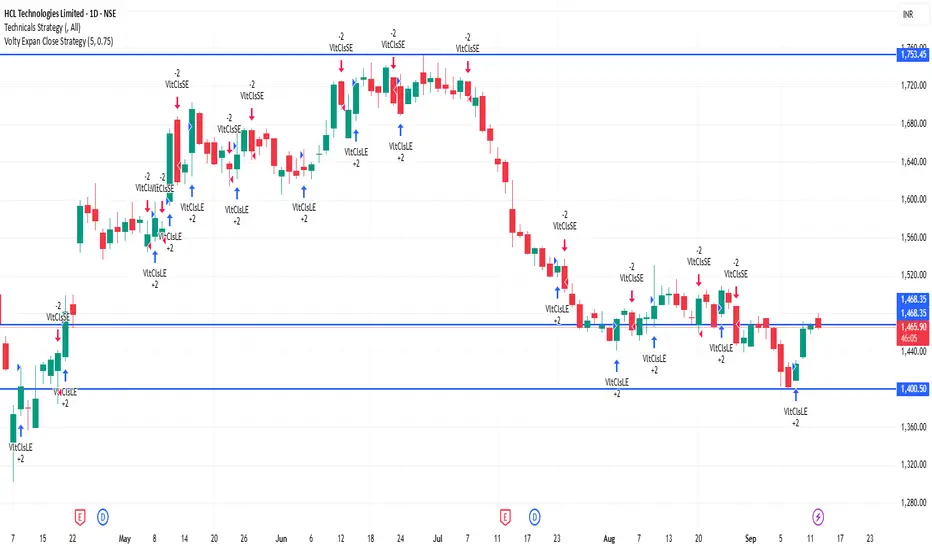
HCLTECH 1D Time frame🔢 Current Level
Trading around ₹1,465 – ₹1,470
🔑 Key Resistance & Support Levels
Resistance Zones:
₹1,476 – ₹1,480 (near-term resistance; breakout above this may lead to further upside)
₹1,494 – ₹1,520 (stronger resistance above)
Support Zones:
₹1,460 – ₹1,463 (immediate support; failure to hold above this may lead to a decline)
₹1,450 – ₹1,460 (short-term support; a break below this could indicate weakness)
₹1,431 – ₹1,440 (deeper support zone if price dips further)
📉 Outlook
Bullish Scenario: If HCL Technologies holds above ₹1,463, upward momentum may continue. Break above ₹1,480 can open the way toward ₹1,494 – ₹1,520.
Bearish Scenario: If it falls below ₹1,450, risk increases toward ₹1,431 – ₹1,440.
Neutral / Range: Between ₹1,463 – ₹1,480, HCL Technologies may consolidate before a directional move.
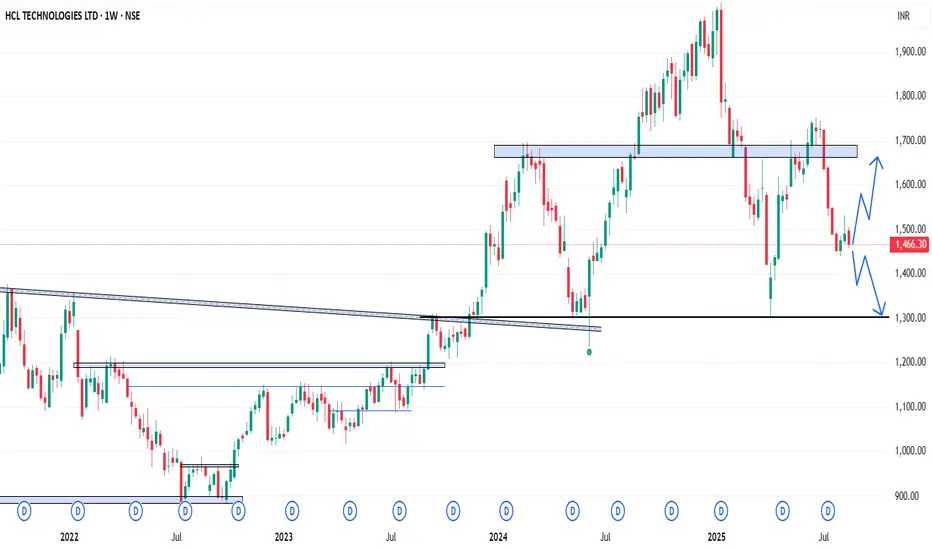
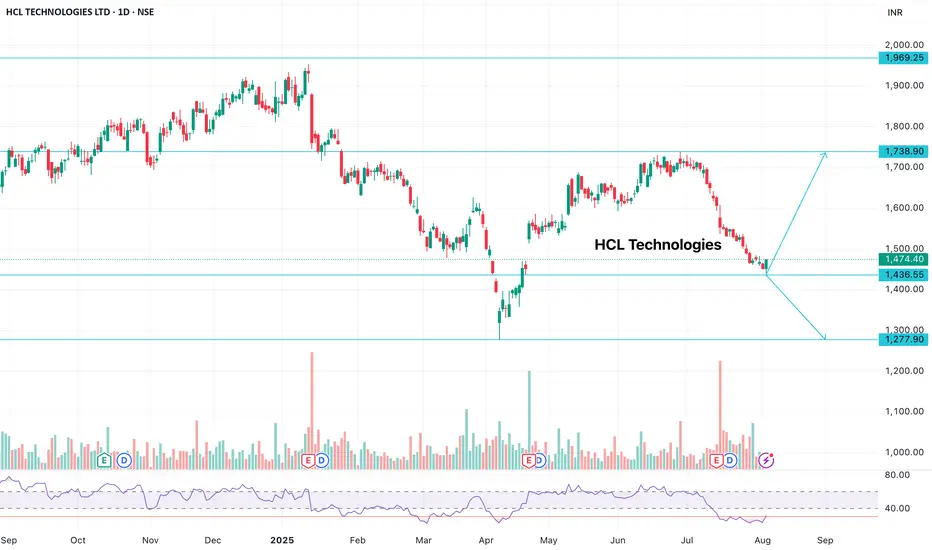
HCLTECH - Weekly AnalysisIn the Weekly Chart of HCLTECH ,
we can see that, it is at decision making point.
Possible momentums are shown in chart.
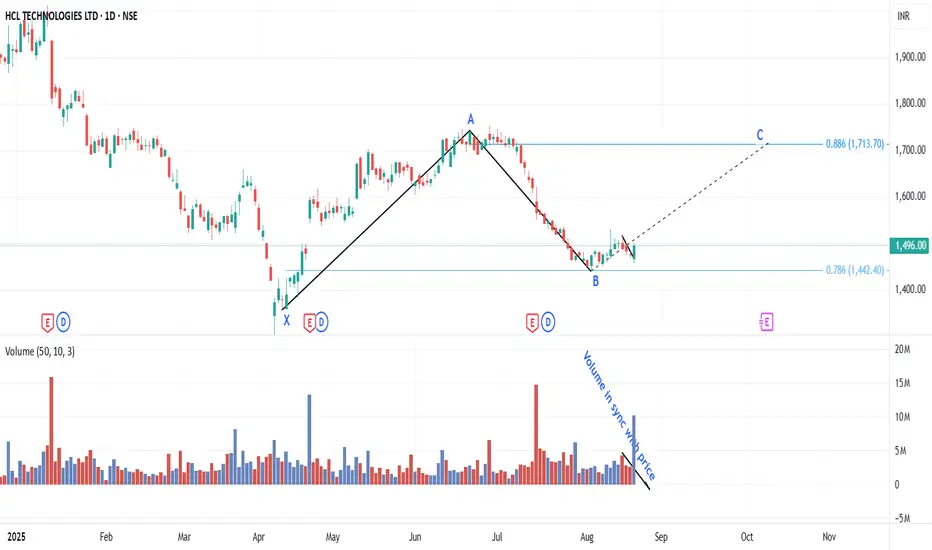
HCLTech bullishHCLTech 1496 has completed its bearish second leg of butterfly formation at 1442 and expected to begin its bullish third leg for target 1713. Volume in sync with price move.
CONCEPT OF FAIR VALE GAPA bullish Fair Value Gap (FVG) signals strong buying pressure, showing imbalance where demand exceeds supply, often indicating potential upward continuation.
Long Term Long Trade - HCL, Infy, TCSThe IT pack is looking to start up now. HCL has started, Infy and TCS are about to.... Enter above this week's high, stop loss below the previous low as shown in video. Trail your stops. Enjoy. Use your discretion.

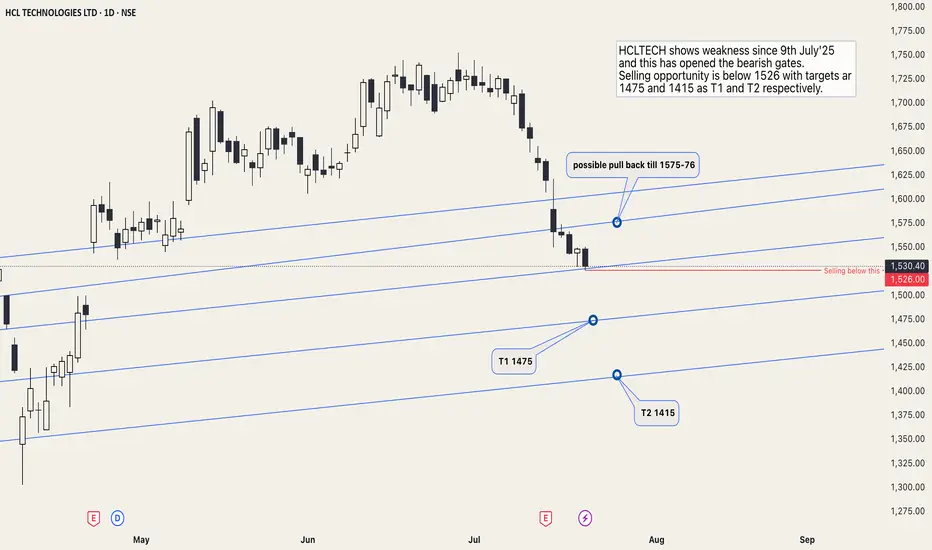
HCLTech bearish strategyHCLTECH has shown weakness since 9th July'25, and this has opened the bearish gates.
The selling opportunity is below 1526, with targets at 1475 and 1415 as T1 and T2, respectively.
The price is also inclined to pull back before it falls further, almost till 1576-75. If the price doesnt give a valid breakdown at the selling entry price, the bearish move will be at halt for sometime.
Stock is at Swing Support zoneEither side Breakout is Possible in this counter. Keep in Radar for the Month of August.
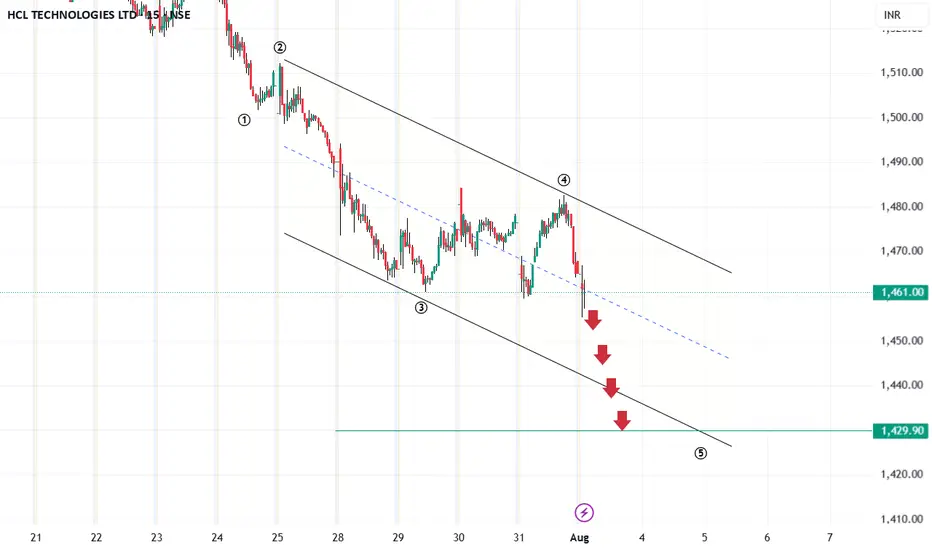
HCL TECHIN this chart we clearly see that 4th wave is complete . It may go down for 5th wave let's see
Disclaimer:- Invest at your own risk,, i am not register with Sebi.. This chart is according to my technical analysis which i learnt from past years
HCL Bearish View Support Price 1237Here's a detailed overview of **HCL Technologies' business model**:
---
## 🔷 **HCL Technologies – Business Model Overview**
### 🏢 **Company Overview**
* **Name:** HCL Technologies Ltd
* **Founded:** 1976 (as part of HCL Group)
* **Headquarters:** Noida, Uttar Pradesh, India
* **CEO & MD:** C. Vijayakumar
* **Industry:** Information Technology (IT) and Consulting
* **Stock Listing:** NSE: HCLTECH | BSE: 532281 | Part of Nifty 50
---
## 🔑 **Key Business Segments**
### 1. **IT and Business Services (ITBS) – \~65% Revenue**
* Application development & maintenance
* Digital transformation (Cloud, AI, IoT)
* Cybersecurity services
* IT infrastructure services (Data centers, network)
* Enterprise integration & modernization
### 2. **Engineering and R\&D Services (ERS) – \~20% Revenue**
* Product engineering & lifecycle management
* Embedded software & systems
* Industry 4.0 solutions
* Used by sectors like automotive, aerospace, healthcare, and telecom
### 3. **Products & Platforms (P\&P) – \~15% Revenue**
* Proprietary software products & platforms
* Examples: HCL BigFix (security), DRYiCE (AI Ops), Workload Automation
* Generates recurring revenue through licensing & SaaS
---
## 🌍 **Geographical Revenue Split**
* **Americas:** \~60%
* **Europe:** \~25%
* **Rest of the World (RoW):** \~15%
---
## 👥 **Target Customers**
* Large enterprises across sectors:
* BFSI (Banking & Financial Services)
* Healthcare & Life Sciences
* Manufacturing
* Retail & CPG
* Technology & Services
* Public Sector
---
## 💰 **Revenue Model**
* **Time & Material contracts** (hourly billing)
* **Fixed-price projects**
* **Managed services contracts** (long-term, outcome-based)
* **License/subscription fees** (for software products)
* **Cloud & Digital transformation fees**
---
## 🤝 **Business Strategy**
1. **Mode 1-2-3 Strategy**
* **Mode 1:** Core IT & application services
* **Mode 2:** Digital & analytics, cloud-native, IoT, cybersecurity
* **Mode 3:** Products & platforms
2. **Acquisitions & Partnerships**
* Acquired IBM software products in 2019
* Collaborations with Google Cloud, Microsoft Azure, AWS
3. **Innovation & IP Focus**
* Investment in AI, automation, and internal platforms
* DRYiCE (AIOps and service automation)
4. **Global Delivery Model**
* Offshore delivery centers in India
* Nearshore/onshore centers in the US, Europe, APAC
---
## 📈 **Growth Drivers**
* Increasing digital transformation globally
* Strong product-led business expansion
* Deep client relationships (high repeat business)
* Cost-effective delivery through offshore talent
---
## 🧾 **Recent Financial Snapshot (FY24)**
* **Revenue:** \$13.3+ Billion
* **Net Profit:** \$1.8+ Billion
* **Employees:** 225,000+ globally
* **Client Base:** 1000+ active clients; many Fortune 500 firms
---
## 📊 SWOT Analysis
| Strengths | Weaknesses |
| ------------------------ | ---------------------------------- |
| Strong global presence | Dependency on North America |
| Broad service portfolio | Low product revenue share |
| Consistent profitability | Intense competition in IT services |
| Opportunities | Threats |
| ------------------------- | --------------------------------- |
| AI & cloud service demand | Global economic slowdown |
| SaaS & product IP growth | Pricing pressure from competitors |
| Strategic acquisitions | Currency & regulatory risks |
---
Thanks
HCL Technologies Ltd.HCL Tech is a leading global IT services company, which is ranked amongst the top five Indian IT services companies in terms of revenues. Since its inception into the global landscape after its IPO in 1999, HCL Tech has focused on transformational outsourcing, and offers an integrated portfolio of services including software-led IT solutions, remote infrastructure management, engineering and R&D services and BPO. The company leverages its extensive global offshore infrastructure and network of offices in 46 countries to provide multi-service delivery in key industry verticals.
Market Cap: ₹ 4,04,363 Cr.
Promoter holding: 60.8 %
FII holding: 18.6 %
DII holding: 16.2 %
Public holding: 4.24 %
Debt: ₹ 6,276 Cr.
Debt 3Years back: ₹ 6,343 Cr.
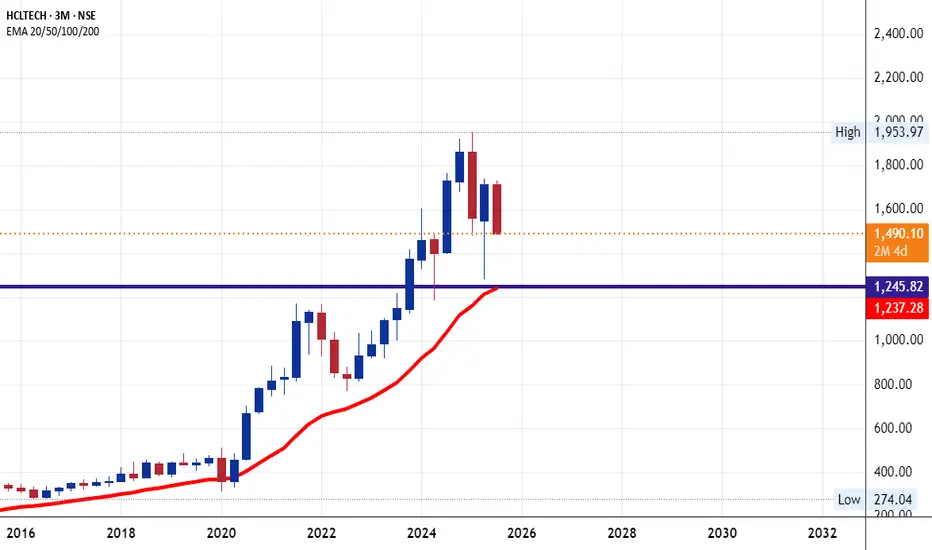
Analysis: Current wave showing some selling pressure. This is weekly chart, so if you see there, 1310-1375 is crucial support zone. where 1300 is strong support. Once this is break then it will be give more fall till 930 where again new strong support will be formed.
930 is the possible reversal level. So, If it is reversed from 930, then targets will be 1180-1467-1590-2012-2685.
So, best opportunity will come in the HCL Tech soon.

HCLTECHBased on my analysis for long Only for education purpose only not for any buying or selling recommendations.

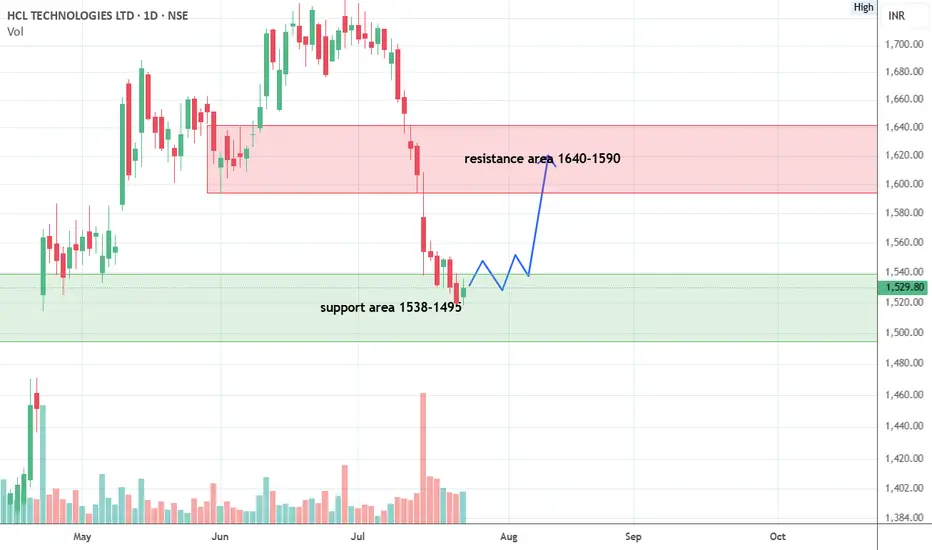
HCL Tech seems a good buy @ 1530-1520 rangeDate: 24-Jul-25
After the Q1 results on 14th July, HCL Tech seems to have bottomed out near 1500 range
Stock tried breaking 1520 but sustained and closed at 1529 with increasing volms on 23-Jul-25
Most likely it will try to touch the next resistance area of 1590 and then onward to 1620, 1640 area. Likely to reach the target by 25th Sept making 5 to 6% returns in 2 months.
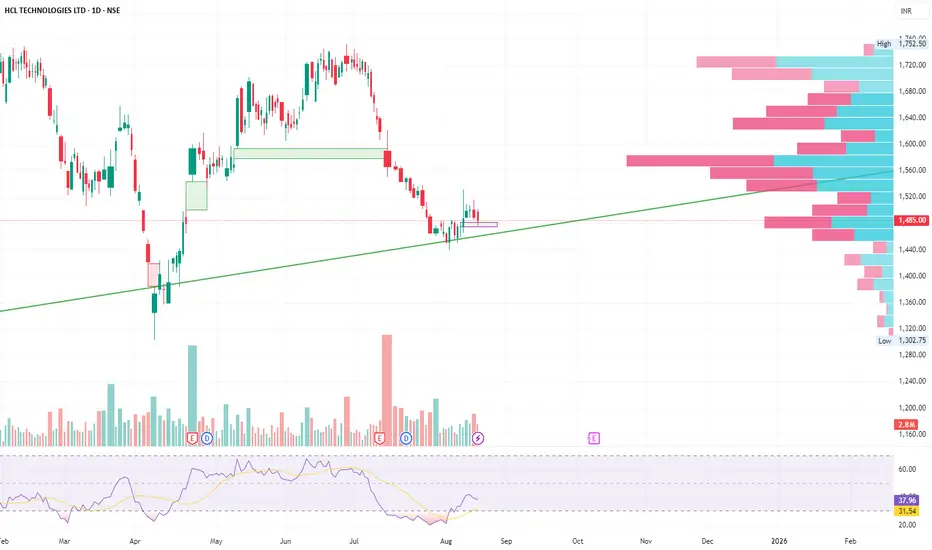
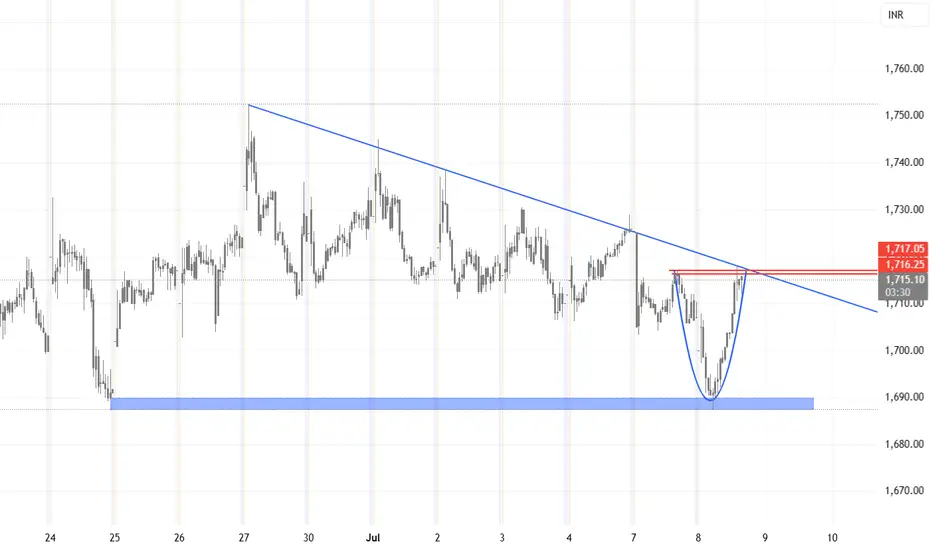
HCL techbounced back from support. near trend line and V shape break out. however, with global uncertainty one should be very careful. this is just an analysis and no buy or sell recommendations
The rally is over HCL Tech CMP 1726
Fib ext - the fib ext nailed both the 3tr wave and the top of 5th wave. Thats the beauty of fib ext if the points are taken correctly.
Elliott - the B wave rally is over and now the C wave downfall will begin. The minimum tgt for C wave is swing lows at 1300.
Oscillators - both the oscillators are under their averages. This is a sign of danger.
Conclusion - the negative indications have come on the monthly charts. Hence this correction will not be something that will not hurt. Last several posts I have asked u to avoid bottom fishing in IT stocks.

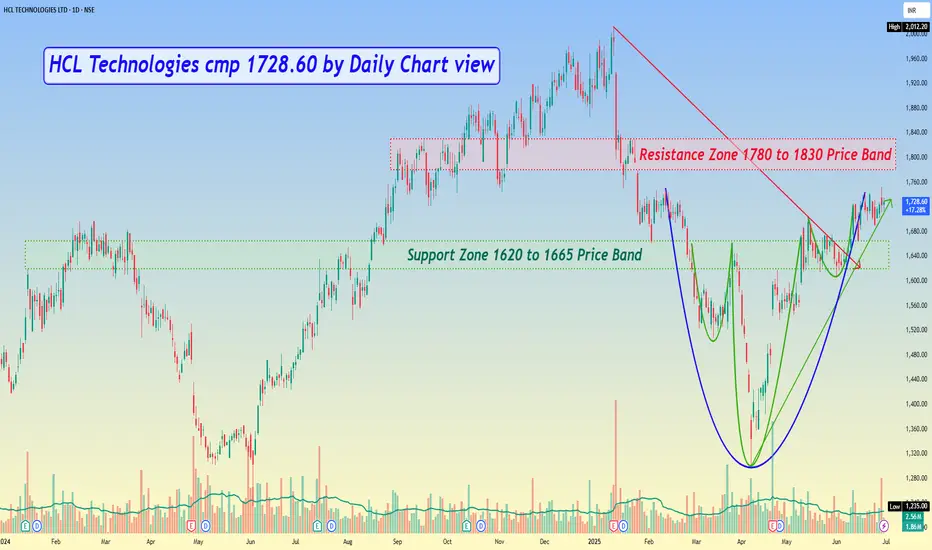
HCL Technologies cmp 1728.60 by Daily Chart viewHCL Technologies cmp 1728.60 by Daily Chart view
- Support Zone 1620 to 1665 Price Band
- Resistance Zone 1780 to 1830 Price Band
- Bullish Rounding Bottom and faintly considerate Head & Shoulder too
- Volumes have been spiking regularly well above the average traded quantity over past few weeks
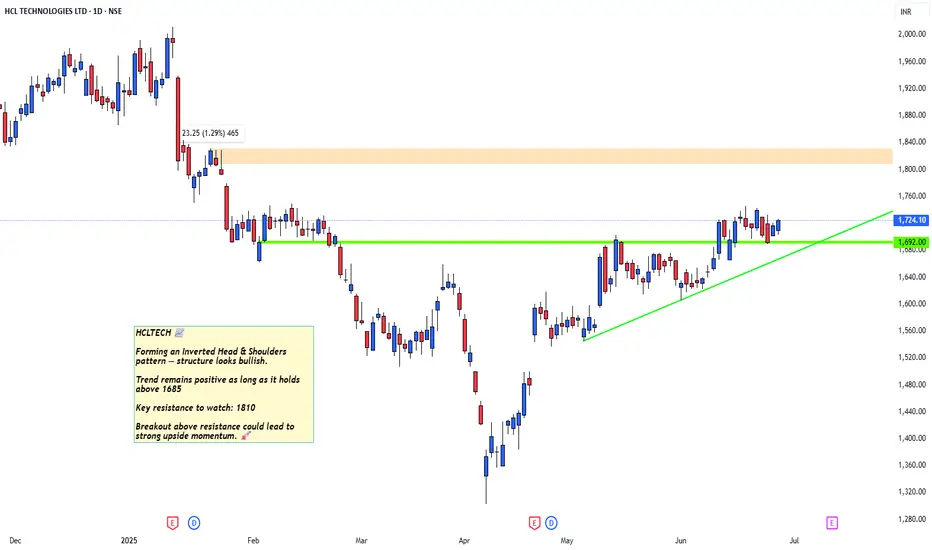
HCLTECHHCLTECH 📈
Forming an Inverted Head & Shoulders pattern — structure looks bullish.
Trend remains positive as long as it holds above 1685
Key resistance to watch: 1810
Breakout above resistance could lead to strong upside momentum. 🚀