#StockMarket #StockIdeas #StocktoWatch #StockToBuy #positionalHCL TECHNOLOGIES
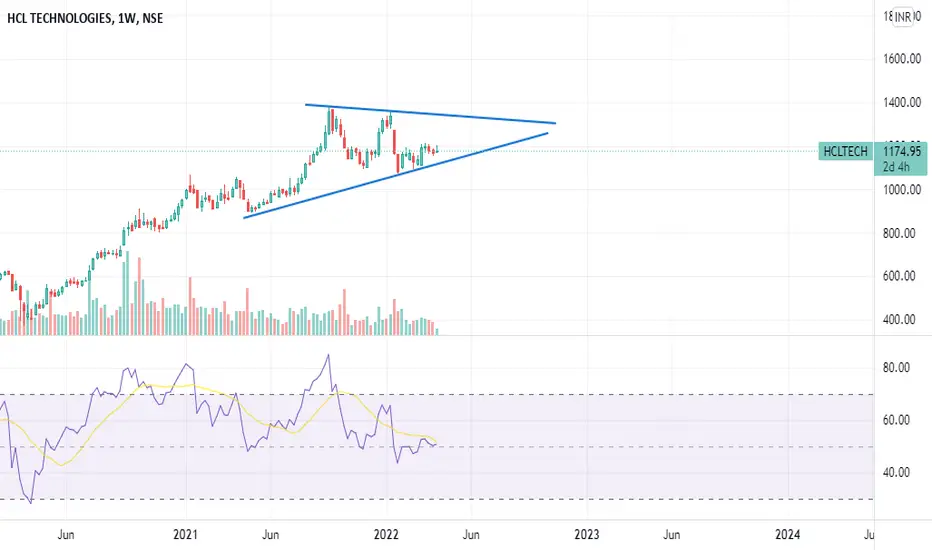
On daily chart Stock trading in a Channel and now at bottom of channel
Keep on watchlist for any side moveand took trade for4-7%
Also keep on watch for Intraday, with 5min chart for Targets and SL; based on support/resistance
In case of Gap up or Gap down, avoid Intraday trade
----
Note:
Above levels are for education purposes only
Do your own analysis before taking any trade
Please Like & Follow
Trade ideas


HCLHCL at support
Look for a good green closing for a valid entry
Technical analysis based on Trendlines & Price action
Use it just for reference and do your own analysis

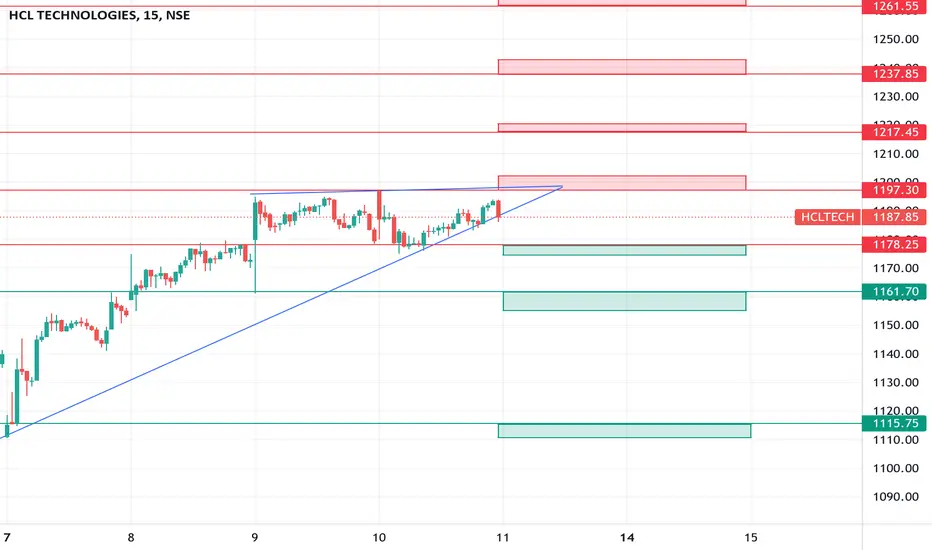
HCL Tech flag and pole patternOn a daily time frame, the stock after a bull Run has been consolidating.
The flag and pole pattern is a bullish pattern and once it breaks out of the parallel channel it will give good targets.
Support :- 1150, 1138
Resistance:- 1223, 1254
Wait for the break out of the parallel channel

hcl tech buyBuy from cmp to 1168
easy tg - 1190
tg2 - 1204
Disclaimer : This is my personal analysis for study purpose not intended for trading

Weekly Triangle Breakout in HCL TECHNOLOGIESWait for Entry., Mostly it works perfectly with good risk reward
HCLTECH falling wedge pattern BO in hourly TFHCLTECH falling wedge pattern BO in hourly TF. Looking bullish in Daily TF also.


#HCLTECH Buy on Weekly Cl abv 1175 , Tgt 1214/ 1268#HCLTECH #SWINGTRADING #CNXIT
Buy on Weekly Cl abv 1175
Tgt 1214/ 1268
SL 1155
Risk : Reward 1:2 ( 1214) & 1:4 (1268)

HCL tech - buy on dipsBuy from 1145 to 1135
easy tg 1160
tg2 - 1190
Disclaimer : This is my personal analysis for study purpose not intended for trading

Intraday setup on 31 march3 hours ago
See the chart and prepare your own trade
Keep strict sl
Risk reward should be more than 1:2
Maximum trades 2-3 per day
Don’t take revenge trades
Disclaimer: iam not sebi registered I and iam not responsible for any profit and loss

hcl for short time buy signalhcl tech. for short time buy signal.
If you get sell signal comment bellow.

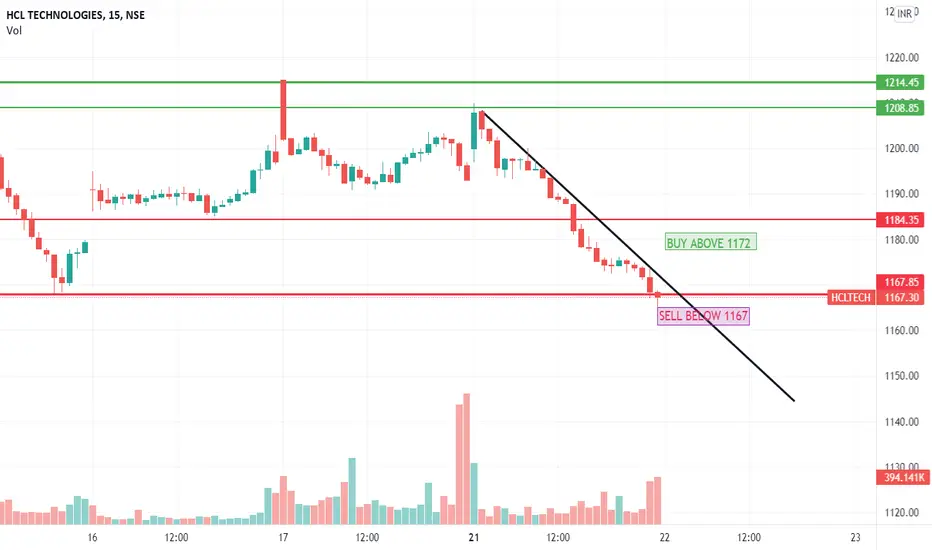
PRICE ACTION ANALYSISIts simple Price Action Based Analysis that if Tomorrow HCL Technology break the support till 1165 then it is good for short. And if it breaks trend resistance till 1172 then its good for long.

HCL Tech giving quick profit opportunityHCL Tech has just crossed a small resistance, as long as it doesnt breach 1190 on the downside, one may go long for 1278 and 1290 as targets

HCL TECH Long HCL TECH Resistance @1194-1200 zone SL1193 DCB (Daily closing basis) TP=1227, 1262++ As you ca see wave analysis wave 1,2, 3 completed now it will give BO and touch 1227, 1240 and come back to 1200 and move towards 1262++ for final TP. also along with it look like Harmonic pattern buy above B point @1194 for TP=1227, 1262++ #Robinhood Investment. ( I am just a BOT trader 😄)

view about HCLTECHit's ready to go for 1280+ to fill the above gap that is on the above side of the chart as you can see.

Intraday trade : watch for resistance breakoutbuy above 1200 in intraday
For stoploss in Intraday use 5 minute chart and see nearest support.
for target use 5 min chart and fibonacci pivots as i don't keep predefined target.
try to book partially and trail.
Note: this is not a prediction for LONG/SHORT, trade will trigger only on given level as per technical analysis
NOTE: For Gapup or bo before 9:20
If gapup is more than 1% from bo level than avoid completely.
if less than 1% or gives bo before 9:20 than wait for
first 5 minute candle and entry above 5 minute candle
and revised SL below candle Low.

Intraday set up HCL tech on march 11See the chart and prepare your own trade
Keep strict sl
Risk reward should be more than 1:2
Maximum trades 2-3 per day
Don’t take revenge trades
Disclaimer: iam not sebi registered I and iam not responsible for any profit and loss
HCL Tech - Harmonic PatternHCL Tech has been steadily moving up with decent volume and is on the verge of breakout above 1200. A closing above 1200 will take it to the target of 1326.

HCL TechnologiesCurrently the stock has discounted 14% from all time high levels.
HCL (Daily):
1. Stock constantly took support at major demand zone around 1098 levels
2. Stock is making Double Bottom
3. Positive crossover of 5, 13 Daily Exponential Moving Average
4. Bounced back from 200 Days Exponential Moving Average
5. Good buying volumes
View Point:
1. If the stock sustains above 1200 (Breakout of Double Bottom), target of 1320 can be seen.
Addl Points:
1. FII/FPI have decreased holdings from 22.30% to 20.43% in Dec 2021 qtr
2. Mutual Funds have increased holdings from 7.84% to 8.95% in Dec 2021 qtr.
Notes:
1. The above analysis is just for educational purpose.

HCL Technologies ltd. Stock analysis 7 March 2022In this stock a raising wedge is forming indicating downward momentum. Levels are given to trade according.

HCL Long time frame view Educational purpose only : 1210 level decide market rally or bear . This 1210 level strong resistance level it is a turning point of HCL Tech. I am updating similar time frame correction here. Updates.
But long time frame wave analysis market in Corrective wave. Coming days unfolding what happens right or alternate wave counts...
