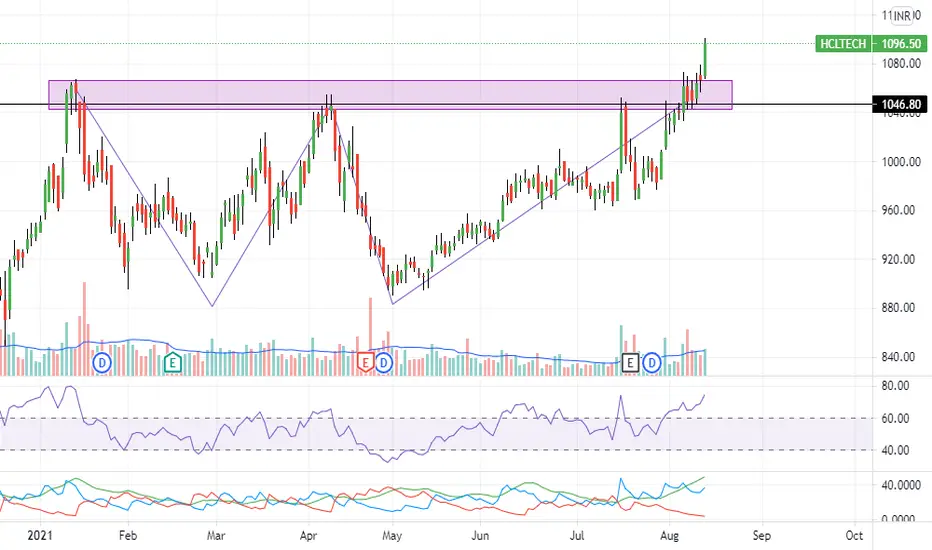
HCL technologies .....Rally expectedThe stock has shown a W pattern an has crossed the resistance zone. The RSi is also increasing . Now its expected to move upwards very fast. See chart for near targets.
Trade ideas


HCL TECH: BREAKOUTThe Stock has been consolidating for lot of time with volumes also relatively less. However it has started to rise with increase in volumes as well.
It has formed a Inverse H&S pattern as well as Cup and Handle pattern.
One can set a target of 1150+as per Fibo Analysis, as there is no other major resistance except psychological resistance at 1100.
It can retrace to 1054 levels before continue its march towards 1100.

HCLTECH had been showing great rally for the last few daysAfter a long time of consolidation NSE:HCLTECH has been able to finally show it's real strength. It's been showing a good rally that can continue for some more time followed by some consolidation. 1150 is a good level for the people who bought it around 900.

HCLTech ConsolidationHCLTech has consolidated and converged in a small tf. Might give move either side.


HUGE 20% BREAKOUT IN HCL TECHHere in this chart the price has crossed the resistance and hopefully will go 15-20% up from here

HCL TECHNOLOGIES.... TO GO LONG OR SHORT?We can see the script getting rejected at the level of major resistance on multiple occasions.
The recent long green candle at this resistance level was considered a good breakout by most traders.
Points in favor of a pullback,
The breakout candle was followed by a bear candle of decent size. The follow-through from the breakout candle is not good, indicating huge selling pressure.
This is also confirmed by the higher volumes in the red candle than the breakout candle.
There is also a bullish divergence in the RSI pattern.
Points favor of a breakout,
The red candle is still above the line of major resistance.
The script after getting rejected from the resistance level a few days back didn't fall back to its support zone (around 900) but is trying to break the resistance again. Multiple hit at the resistance line is likely to weaken it eventually breaking the resistance soon.
So, now breakout or breakdown?
We should wait for one more day and the next candle will decide the course of action. A long green candle can suggest a long trade and a Doji or hammer or long red candle suggest selling and rejection in the script.
Happy trading!

HCL Technologies : Breakout from resistance with momentum #HCLTECHNOLIGIES looks like a breakout of previous resistance after a W pattern. Momentum and trend on all timeframes looks good.Dollar beneficiary move


HCL TECH POSITIONALHCL TECH LEVELS MENTIONED ON CHART
STOCK IS IN UPTREND. POSTIONALLY LOOKING GOOD
Disclaimer: The chart is for educational purpose. Please consult your financial advisor before investing.

HCL Tech Major Resistance BONSE:HCLTECH
Buy near 1060 -1070
SL closing below 990
T 1110, 1140, 1155, 1180

IMPORTANCE OF SUPPLY & DEMAND | HCLNSE:HCLTECH
🔴 Stock market and the price action is all about how the market had reacted to the past behavior and the emotions of the buyers and sellers...
🔴 so, once you have the clear view about the previous trading sessions,
🔴 with that past behavior of buyers and sellers it may help us to predict what is gonna happen in the future with the price...
🔴 When you know the importance of supply and demand you can trade with the clear view of the market moves....
🔴 when the strong supply zone breached or engulfed it is supposed to act as a demand zone in the future.....
🔴 In the same way when demand zone engulfed it may act as a supply zone, it is known as flipping zones or SR flip...
🔴 DISCLAIMER : This is just for educational purpose. Do your own analysis.🔴


hcl tech range bound good to buy at 900-925hcl tech is moving in side ways good to accumulate and we can expect recatangular break out in the long run
900 and below is best price for hcl tech its like fair price
disclaimer- this is not any investment call or idea , this just my view and it can go wrong ,this is only for educational purposes trade at your own risk

hcl tech 1050++ to 1200can expect by results this month
many it stocks rallied but hcl tech has still lot more to go
check previous hcl tech idea if possible ,accumulation zone is 900-925 so incase breaks down also that would be good dip
but chances of reaching 925 from here is very very low
disclaimer- this is not any investment call or idea , this just my view and it can go wrong ,this is only for educational purposes trade at your own risk

HCLTECH has given good closingNSE:HCLTECH has been able to give closing above 1060 levels today. This time it looks like we'll be able to see 1080 levels.

HCL Technologies: Intraday AnalysisHCL Technologies forming a symmetrical triangle on 15 Minute chart and simultaneously taking support from the Demand and Supply Zone which was previously acting as resistance but now turned into support on multiple occasions.

HCLTECH - BullishTriple Top
VCP Pattern
Buy only above 1065/70 (if breaks with High Volume)
Sl below 1035 CLBS

HCL Tech breaking descending triangle pattern HCL tech making descending triangle pattern in 15M chart. Breaking this pattern can give a good breakout either side, probability of breakout is upside and i can easily break its previous high of 1072.
Reasons of breakout :
1. It had broke its 1045 level on 5 august which was a resistance and being tested on 15 jan, 8 apri & 25 july.
2. Making a descending triangle pattern in 15M chart.
3. 1045 resistance converted into great support after reversal.
4. 200 days EMA being a good support near 1045 support level.

