Trade ideas
11/05/2021 Research Report For HCLTECHBuy @ Below 910
SELL Target 1 :- 921.5
(AFTER 921.5 YOU CAN MAINTAIN TRALING SL and MAXIMIZE YOPUR PROFITS)

HCL TECH, Channel PatternMy opinion: Stock is trading upwards after the recent strong rejection in the bottom part of the channel and 200 EMA is coming for support. Check RSI for momentum while entering. IT companies are safer bets, due to work from home. Thank you. Comment if u agree!
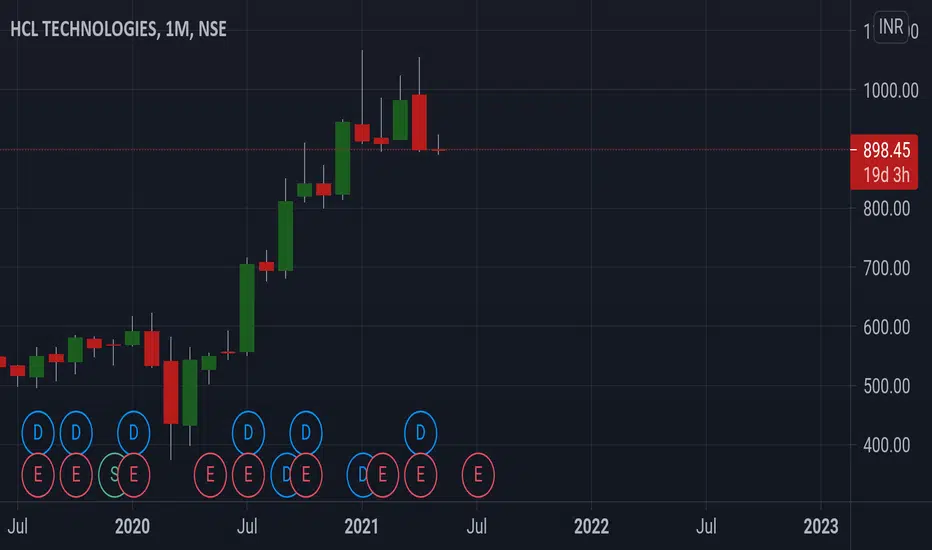
NSE:HCLTECH


HCL Tech will try to break its resistanceHCL Tech is likely to break its Resistance and show a strong upside move. With a major support of 895, downside movement is less probable. RSI and Stochastics also indicate the upside momentum. A strong buy after the breakout is expected. Place stop loss at 890.


HCL Tech finally taken support.For Education purpose only
HCL technologies
Buy above 923
Target- 1000, 1080
SL- 890
Below 890
Target- 800
SL- 915
Dtd 8th May 2021


Can we say HCL Tech forming FLAG pattern on 15 mins chart ?I am new to market. Learning different strategies. Suggestions are most welcome.

HCL Buy IdeaHCL is a largecap IT company which has made a price action reversal at support zone. So enter the trade with excellant 1:4 reward ratio.


STUDY 6: OPEN WEDGE - HCLThis is Just for study purpose. HCL seems to be a open wedge. Buy now with stop loss of 1 or 2 %.


HCL Tech_15% possible upside before qtrly and annual resultsDate: 05 April 2021
HCL Tech has given a breakout at Symmetrical Triangle pattern. A 15% upside is possible in short term.

hcl tech rounding bottom ..buy above resistance break above 930..target 952.975..
stoploss would be 920

Inverse head and shoulder pattern in HCLAn inverse head and shoulder pattern is formed and it has also broken a short term downward trend line. Can be bought for target of 950-960.
Please like and follow!
Happy Trading :)
