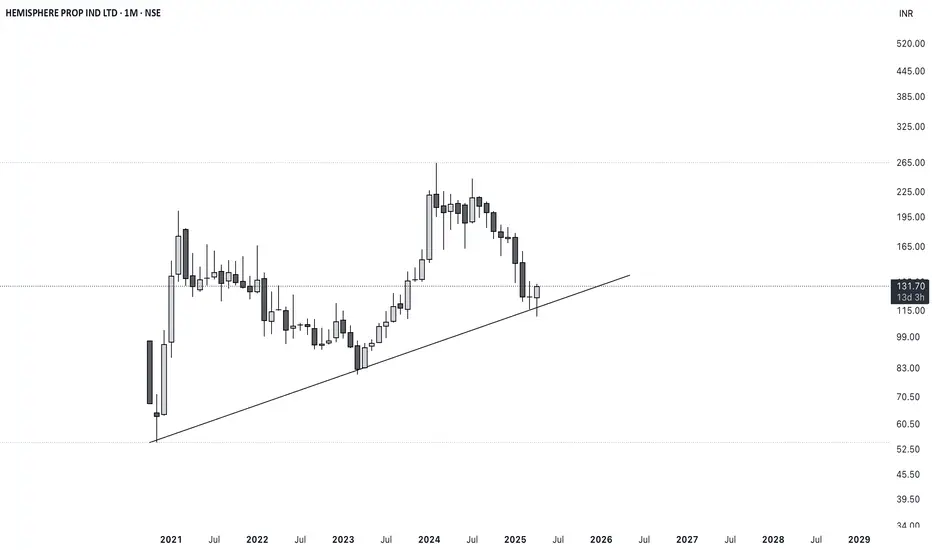
BUY HEMIPROP FOR MID TO LONG TERMThe price has recently touched and bounced off a long-term ascending trendline that has acted as strong support since 2021. This bounce could indicate a potential reversal or at least a temporary bottom current candle is bullish with a long lower wick, suggesting buying pressure at lower levels, which is typically a good sign for reversal.
Assuming the support holds and momentum continues, here are the potential upside targets based on historical price action and resistance levels:
First Target: ₹165 – Previous minor resistance zone.
Second Target: ₹195 – Stronger resistance seen multiple times in 2024.
Third Target: ₹225 – Last significant swing high.
Long-term Potential: ₹265+
If the trend continues and momentum builds.Conservative Stop Loss: ₹110 – Below the recent swing low.
Aggressive Stop Loss: ₹99 – Just below the trendline breakdown (to allow for volatility).
Invalidation: Sustained close below ₹110–99 zone.
Trade ideas
BUY TODAY SELL TOMORROW for 5%DON’T HAVE TIME TO MANAGE YOUR TRADES?
- Take BTST trades at 3:25 pm every day
- Try to exit by taking 4-7% profit of each trade
- SL can also be maintained as closing below the low of the breakout candle
Now, why do I prefer BTST over swing trades? The primary reason is that I have observed that 90% of the stocks give most of the movement in just 1-2 days and the rest of the time they either consolidate or fall
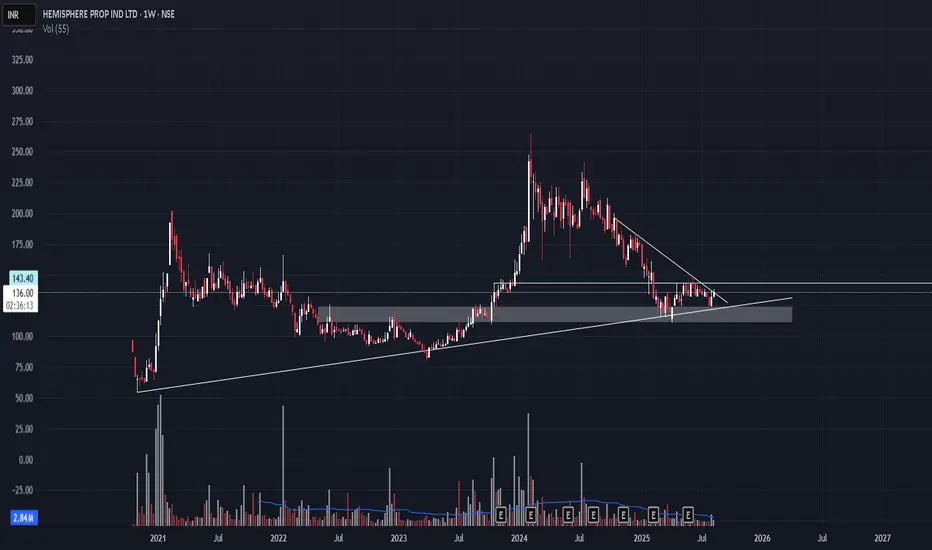
Round Bottom & Retested Breakout in
HEMIPROP
BUY TODAY SELL TOMORROW for 5%

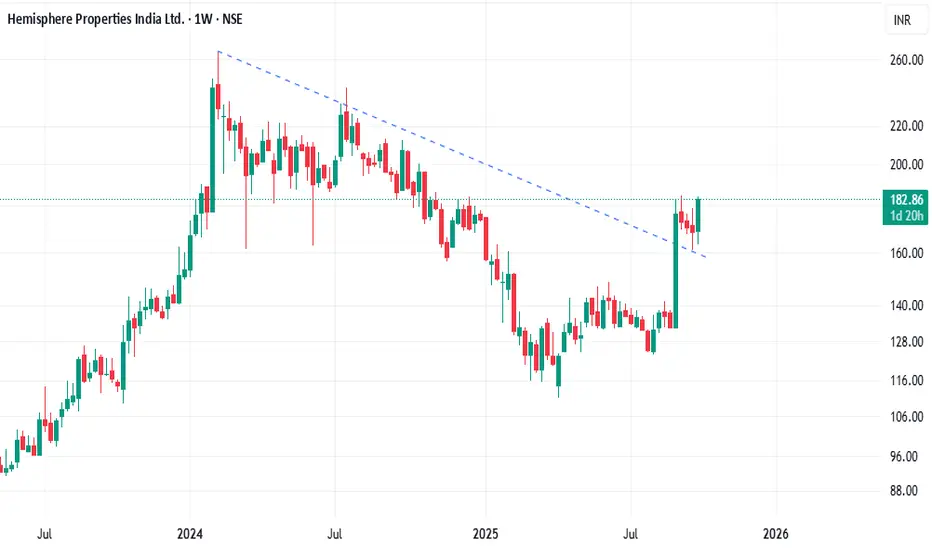
Hemisphere Properties India Ltd. (Weekly Chart)🔎 Chart Structure
The stock was in a prolonged downtrend since early 2024, capped by a falling trendline.
Recently, it gave a trendline breakout above the ₹175–₹180 zone.
Importantly, the breakout has been retested successfully – price dipped towards the trendline support, held firmly, and bounced back.
This retest adds strength and reliability to the breakout, suggesting a shift in trend from bearish to bullish.
📈 Trend & Indicators
Sustaining above ₹180 confirms bullish control.
Next resistance levels: ₹200–₹205 zone (swing high) and ₹225 (medium-term).
Supports: Immediate at ₹165, stronger support near ₹145.
Weekly momentum is turning positive, confirming renewed buying interest.
⚠️ Risk Factors
If the stock falls back below ₹165, the breakout may fail, leading to consolidation.
Sectoral news and overall market conditions will heavily influence momentum.
🎯 View
Bias: Bullish (Post Breakout & Retest Confirmation)
Targets: ₹200 (short-term), ₹225 (medium-term).
Stop Loss (Positional): ₹160 (weekly closing).
📌 Disclaimer
This analysis is for educational and informational purposes only. It is based on technical observations and does not constitute investment advice. Investors should consult a SEBI-registered financial advisor before making investment decisions.
HEMIPROP chances of survival?? The company was formed as part of the disinvestment exercise carried out by the Government of India in respect of its holdings in the erstwhile VSNL (currently known as Tata Communications Limited).
President Of India holds 51% stake
Hemisphere Properties of India, a perfect VCP VCP stands Volatility Contraction Pattern by Mark Minervini (One should read his all books)
Perfect VCP (15W-39/4-4T), meaning price n volume contracting for 15 weeks from 39% to 4% with 4 contractions(39%, 19%, 15%, 4%)

BREAKOUT IN HEMIPROP 📌SWING TRADE FOR NEXT WEEK🚀
Hello Traders⚡
I am a Swing Trader by Passion i only trade on Momentum Stock's.
📌I Post Daily SWING CHARTS Analysis on My Trading view profile..
So let's Start
📌TRADE ANALYSIS OF HEMIPROP
• Potential Breakout Chart
• VCP Pattern
• Short Range Consolidation
• Price Can Take Retest from support Line
• Overall The Price Is Moving In HH-HL Formation
• Volume Buildup Near BO Zone
• Looks Good For 10-20% Upside Levels After The Breakout
📌 If you have any questions about any stock you can comment on post 📱
📌Disclaimer:-
This all chatrs analysis are only for educational purposes only
I do not provide any CALL or Tips


Realty Sector Is Booming My Pick Is....-Rsi very strong
-decent volume
-strong closing
-other realty sector stocks already given breakout

Hemisphere Properties- Has Bullish Hemisphere propertiesHemisphere not only in name but also in pattern. RB breakout done on daily. If the weekly candle close is above the resistance line then it will fly to 320. Strict entry after the weekly candle close is advisable. For aggressive entry, keep the candle close on weekly below the resistance line as the stop loss.
Team Stocks-n-Trends

Hemisphere Properties India Ltd - Long Setup, Move is ON...#HEMIPROP trading above Resistance of 201
Next Resistance is at 277
Support is at 155
Here are previous charts:
Chart is self explanatory. Levels of breakout, possible up-moves (where stock may find resistances) and support (close below which, setup will be invalidated) are clearly defined.
Disclaimer: This is for demonstration and educational purpose only. This is not buying or selling recommendations. I am not SEBI registered. Please consult your financial advisor before taking any trade.

Hemisphere Properties India Ltd - Long Setup, Move is ON...#HEMIPROP trading above Resistance of 128
Next Resistance is at 155
Support is at 99
Here is previous chart:
Chart is self explanatory. Entry, Resistances and Support are mentioned on the chart.
Disclaimer: This is for demonstration and educational purpose only. This is not buying or selling recommendations. I am not SEBI registered. Please consult your financial advisor before taking any trade.

HEMIPROP - Go Long & Short Term For Educational Purposes...
#HEMIPROP IS READY TO BUY LONG
- On Monthly Chart Showing
--- N Pattern Breakout
--- After 11 year Breakout
---- Huge Volume Showing Last 2 -3 Months
-----Fib Level 0.5 Closing 140-145
Waiting Time 3-6 Months
Buy Small QTY
Long Above (Monthly Candle Close Required Above) - 140-145
SL - 125 (Weekly candle Low)
Target - 165, 175, 185, 200 & More..
Thank you

HEMIPROP Possible UpsideResistance break possible, retesting resistance, last buy at resistance at good volumes, RSI also closing in on 70, MACD inconclusive although it is turning back from the possible inflexion point, this a educational analysis only

Breakout in Hemisphere Properties India Ltd...Chart is self explanatory. Levels of breakout, possible up-moves (where stock may find resistances) and support (close below which, setup will be invalidated) are clearly defined.
Disclaimer: This is for demonstration and educational purpose only. This is not buying or selling recommendations. I am not SEBI registered. Please consult your financial advisor before taking any trade.

3 Amazing swing trade ideas for 16 October markets I daily make educational content videos for swing / positional trading

HEMISPHERE PROPERTIES-Likely W-Break OutHEMIPROP: Formed Double bottom in weekly chart. after consolidation shows spurt in volume and is likely to give a neckline break out at 125 levels.if sustains likely to test 145 (positional)
(For Educational purpose only)


HEMIPROP is Building Up!HEMIPROP is Building Up!
Hemisphere Prop India Ltd. is accumulating after a period of weakness. This is a good time to enter the stock for a positional trade or momentum investment. The stock is expected to move higher in the coming months, with targets of 125 and 140.
Here are the trade details:
Stock: Hemisphere Prop India Ltd.
Category: Small Cap
Type: Positional Trade or Momentum Investment
Duration: More than 60 days
Entry Level: Between 100 and 105
Stop Loss: Initial 96 (Trail accordingly)
Target-1: 125
Target-2: 140
Here are the chart details:
The stock has created a base (support zone) at the 100 level.
The stock is trading in an accumulating zone, which is a good sign for a long-term investment.
The Relative Strength (RS) and RSI indicators are positive and showing strength.
The stock is bouncing from the 200 DMA level and turning from a downtrend to an uptrend.
I'm bullish on Hemisphere Prop India Ltd. and believe that it has the potential to reach new highs in the coming months. If you're looking for a small-cap stock with growth potential, Hemisphere Prop India Ltd. is a good option to consider.
Here are some additional things to keep in mind:
The stock is volatile, so be prepared for some price fluctuations.
The earnings could be a catalyst for the stock to move higher.
Keep an eye on the overall market conditions and adjust your position accordingly.

HnS PatternWait for retest or ride the possibility of a trend with a strict stoploss.
P.S.: one would find very little writeup on my posts as I firmly believe everything is on the charts...Price, Volume & Time.

Stage 2 Breakout in progress 📌Stage 2 Breakout in progress
✅Keep an eye
#HEMIPROP
- Cup & Handle Pattern
- Good Accumulation Volume
- Above Key EMAs
- Bullish RSI

Cup & Handle Pattern📌Cup & Handle Pattern
✅Add in your watchlist
#HEMIPROP
- Cup and Handle at an Important resistance
- Volume & Volatility contraction
- Above Key EMAs
- Bullish RSI

HEMIPROPHEMIPROP:- The stock has formed a falling wedge pattern, which has given a breakout, if the stock sustains above 101.50, we may see a movement to the upside.
Hello traders,
As always, simple and neat charts so everyone can understand and not make it too complicated.
rest details mentioned in the chart.
will be posting more such ideas like this. Until that, like share and follow :)
check my other ideas to get to know about all the successful trades based on price action.
Thanks,
Ajay.
keep learning and keep earning.

a good longone of the high probable trade with good rr.
will take some time but will see something good in return
