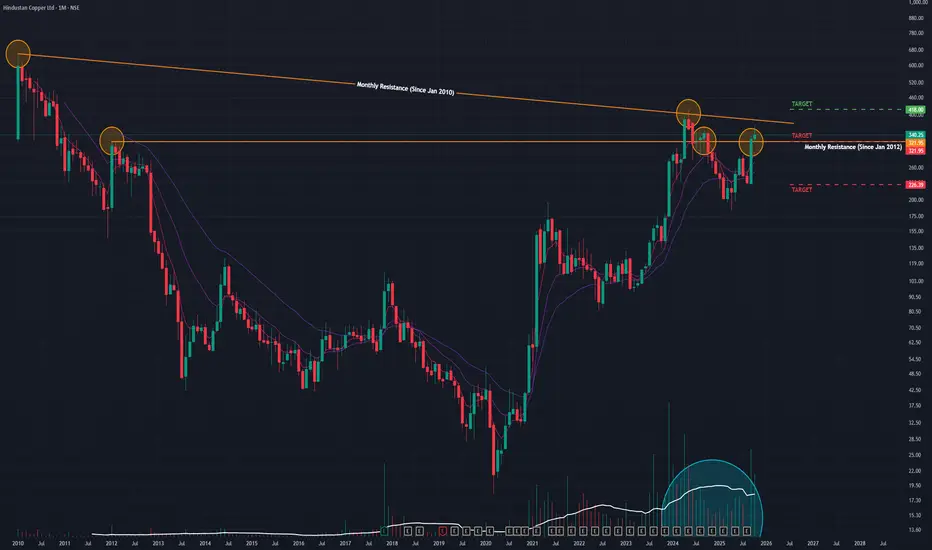
Hindustan Copper at the verge of breakout on monthly chart Hindustan Copper is in a strong uptrend and is currently testing a long-term descending trendline resistance on the monthly chart.
The RSI and price structure hint at a crucial inflection zone for the next major move.
Key observations
Price has rallied to around 382, exactly into a decade‑long f
Hindustan Copper Ltd
No trades
5.85 INR
4.65 B INR
20.61 B INR
327.27 M
About Hindustan Copper Ltd
Sector
Industry
CEO
Sanjiv Kumar Singh
Website
Headquarters
Kolkata
Founded
1967
Identifiers
2
ISININE531E01026
Hindustan Copper Ltd. engages in the exploration, exploitation, and mining of copper and copper ore. Its products include cast copper rod, copper cathode, copper concentrate, copper sulphate, sulphuric acid, reverts, anode slime, and nickel cathode. The company was founded on November 9, 1967 and is headquartered in Kolkata, India.
Related stocks

HINDCOPPEROn monthly charts:
Very high volume
monthly HH formation
Sector is very positive.
CATALYST BEHIND VOLUME:
1. Strong quarterly results with sharp profit growth improved investor confidence.
2. Global copper prices near highs boosted earnings outlook for copper producers.
3. Mine expansion plans an

Hind copper- From Ashish sir's blogThis is currently in its 5th wave progression. as per the rule of equality wave 5 should take around 55 days and around 25% spike. Lets see how things play out.

Hindustan Copper – Multi-Year Channel Breakout Hindustan Copper is attempting a breakout on the weekly timeframe after bouncing strongly from the long-term rising channel support. Price is above all major moving averages with volume expansion, indicating renewed bullish momentum.
Key Levels:
Resistance: ₹386
Support: ₹338 (SL – weekly close)

Unlocking Market Rotations1. What Are Market Rotations?
Market rotations occur when institutional investors—mutual funds, hedge funds, pension funds, sovereign wealth funds—shift large pools of capital from one sector or asset class to another. These shifts often occur in anticipation of economic changes, earnings trends, o
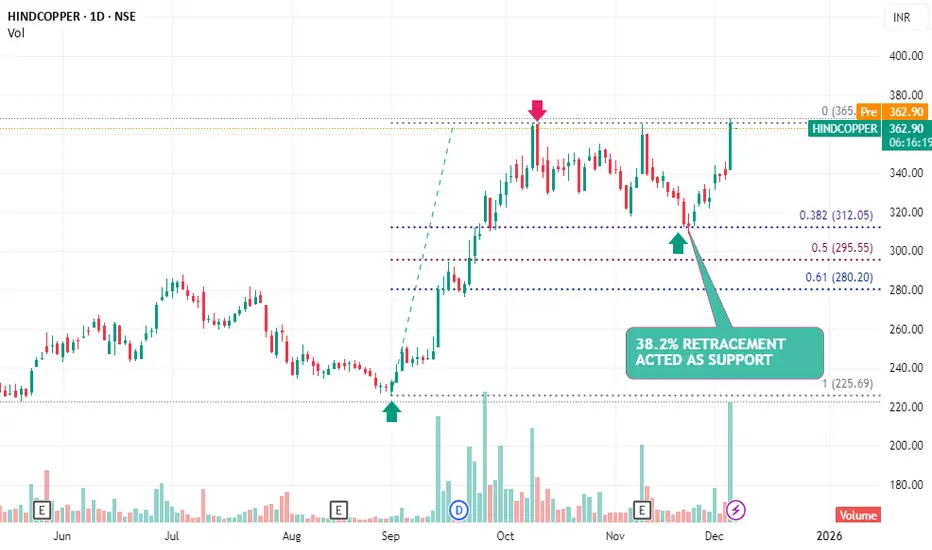
HINDCOPPER – Support at 38.2% Retracement With Reversal SignalHIHINDCOPPER has respected the 38.2% Fibonacci retracement level, indicating that buyers are active at this key support zone. The formation of a reversal candle (DOJI) at this level strengthens the probability of a reversal from the recent corrective decline.
Technical Highlights
Price retraced to th

HindCopper (M): Very Bullish, but at a major inflection pointThe stock has successfully completed a multi-decade base breakout and is now challenging its final long-term resistance. The momentum is bullish, but a new ATH will require a confirmed break of the 2010 trendline.
📈 1. The Long-Term Context (The "Big Picture")
- Parabolic Uptrend: After hitt
HINDCOPPER: High-Tight FlagHINDCOPPER is demonstrating a classic High-Tight Flag pattern. This is one of the most powerful continuation patterns, typically seen in strong market leaders.
"High": A massive, powerful rally (the pole) from the August lows to the recent peak near ₹360, confirming extreme demand.
"Tight Flag"

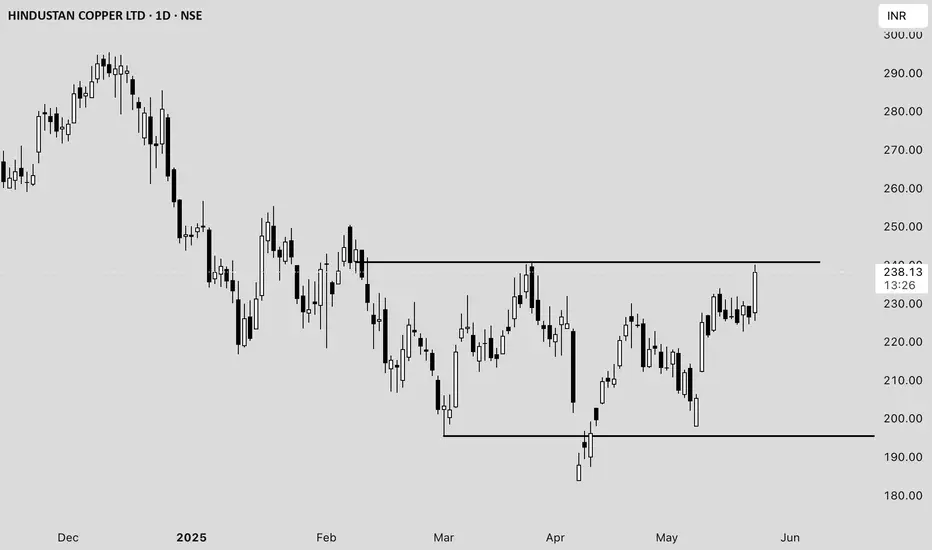
Hindustan Copper Ltd. (HINDCOPPER) Price Analysis **Date:*#### **Current Price and Intraday Movement**
- **Latest Price:** ₹237.98 (+5.09% / +₹11.52)
- **Day’s Range:** ₹225.50 – ₹240.10
- **Open:** ₹227.60
- **Previous Close:** ₹226.46
- **Volume:** 1.63 crore shares (well above average daily volume of 55.89 lakh)
#### **Technical Overview**
- **52-
See all ideas
Summarizing what the indicators are suggesting.
Neutral
SellBuy
Strong sellStrong buy
Strong sellSellNeutralBuyStrong buy
Neutral
SellBuy
Strong sellStrong buy
Strong sellSellNeutralBuyStrong buy
Neutral
SellBuy
Strong sellStrong buy
Strong sellSellNeutralBuyStrong buy
An aggregate view of professional's ratings.
Neutral
SellBuy
Strong sellStrong buy
Strong sellSellNeutralBuyStrong buy
Neutral
SellBuy
Strong sellStrong buy
Strong sellSellNeutralBuyStrong buy
Neutral
SellBuy
Strong sellStrong buy
Strong sellSellNeutralBuyStrong buy
Displays a symbol's price movements over previous years to identify recurring trends.
SMALLCAP
Mirae Asset Nifty Smallcap 250 Momentum Quality 100 ETF Units Exchange Traded FundWeight
0.89%
Market value
709.91 K
USD
Explore more ETFs
Frequently Asked Questions
The current price of HINDCOPPER is 418.60 INR — it has increased by 1.09% in the past 24 hours. Watch Hindustan Copper Ltd stock price performance more closely on the chart.
Depending on the exchange, the stock ticker may vary. For instance, on NSE exchange Hindustan Copper Ltd stocks are traded under the ticker HINDCOPPER.
HINDCOPPER stock has risen by 7.70% compared to the previous week, the month change is a 25.48% rise, over the last year Hindustan Copper Ltd has showed a 54.18% increase.
We've gathered analysts' opinions on Hindustan Copper Ltd future price: according to them, HINDCOPPER price has a max estimate of 450.00 INR and a min estimate of 450.00 INR. Watch HINDCOPPER chart and read a more detailed Hindustan Copper Ltd stock forecast: see what analysts think of Hindustan Copper Ltd and suggest that you do with its stocks.
HINDCOPPER reached its all-time high on Jan 20, 2010 with the price of 658.00 INR, and its all-time low was 18.25 INR and was reached on Mar 24, 2020. View more price dynamics on HINDCOPPER chart.
See other stocks reaching their highest and lowest prices.
See other stocks reaching their highest and lowest prices.
HINDCOPPER stock is 2.88% volatile and has beta coefficient of 1.71. Track Hindustan Copper Ltd stock price on the chart and check out the list of the most volatile stocks — is Hindustan Copper Ltd there?
Today Hindustan Copper Ltd has the market capitalization of 390.58 B, it has increased by 1.37% over the last week.
Yes, you can track Hindustan Copper Ltd financials in yearly and quarterly reports right on TradingView.
HINDCOPPER net income for the last quarter is 1.84 B INR, while the quarter before that showed 1.34 B INR of net income which accounts for 36.90% change. Track more Hindustan Copper Ltd financial stats to get the full picture.
Yes, HINDCOPPER dividends are paid annually. The last dividend per share was 1.46 INR. As of today, Dividend Yield (TTM)% is 0.36%. Tracking Hindustan Copper Ltd dividends might help you take more informed decisions.
Hindustan Copper Ltd dividend yield was 0.66% in 2024, and payout ratio reached 30.35%. The year before the numbers were 0.33% and 30.13% correspondingly. See high-dividend stocks and find more opportunities for your portfolio.
As of Dec 24, 2025, the company has 1.27 K employees. See our rating of the largest employees — is Hindustan Copper Ltd on this list?
EBITDA measures a company's operating performance, its growth signifies an improvement in the efficiency of a company. Hindustan Copper Ltd EBITDA is 8.68 B INR, and current EBITDA margin is 37.20%. See more stats in Hindustan Copper Ltd financial statements.
Like other stocks, HINDCOPPER shares are traded on stock exchanges, e.g. Nasdaq, Nyse, Euronext, and the easiest way to buy them is through an online stock broker. To do this, you need to open an account and follow a broker's procedures, then start trading. You can trade Hindustan Copper Ltd stock right from TradingView charts — choose your broker and connect to your account.
Investing in stocks requires a comprehensive research: you should carefully study all the available data, e.g. company's financials, related news, and its technical analysis. So Hindustan Copper Ltd technincal analysis shows the strong buy rating today, and its 1 week rating is strong buy. Since market conditions are prone to changes, it's worth looking a bit further into the future — according to the 1 month rating Hindustan Copper Ltd stock shows the strong buy signal. See more of Hindustan Copper Ltd technicals for a more comprehensive analysis.
If you're still not sure, try looking for inspiration in our curated watchlists.
If you're still not sure, try looking for inspiration in our curated watchlists.