BUT ICICI PRU21/9/25 ICICI PRU
Buy Price : 607
Stop Loss : 592
Target 1 : 622
Target 2 : 637
Target 3 : 652
Disclaimer : I am not a SEBI registered analyst,
above forecast for education purpose only. Trade
at your own risk. By all means I am not responsible
for any Profits Or Losses that may occur.
ICICIPRULI trade ideas

Buy ICICI Prudential Life: Wave (iv) Likely Completed
ICICI Prudential Life Insurance completed Wave (iii) on 29 May, followed by a classic flat correction (3-3-5 structure) forming Wave (iv).
Structure Breakdown:
Wave A (3-wave down) completed on 13 June
Wave B (3-wave counter) topped on 15 July
Wave C (5-wave impulse) extended into a third sub-wave and completed on 1 August
This C wave also aligned with the 0.5 Fibonacci extension of sub-wave 2–3 to 4 — a typical exhaustion zone (shared the chart in comments below).
Candlestick Confirmation
In the last three trading sessions stock has formed a Three White Soldiers pattern — a strong bullish signal when appearing after a corrective decline.
What’s Next?
Wave (v) is expected to unfold as a 5-wave structure
Potential upside targets based on Fibonacci ratios of wave (0–iii) projected from wave (iv):
Target 1: 674 (0.5 Fibo)
Target 2: 692 (0.618 Fibo)
Trade Plan
Buy Zone: Current levels (~619)
Targets: 674 / 692
Stop Loss: 593

ICICI Pruli Bullish for small swing I'm bullish on ICICI Prudential Life Insurance for a short-term swing trade. The stock is showing strength with a positive trend, healthy Fibonacci retracement, and rising volume support, signaling a potential breakout from its recent consolidation.
📊 Business Snapshot:
ICICI Prudential is one of India’s leading life insurers, backed by ICICI Bank. The company has a strong product mix, digital distribution, and growing assets under management (AUM). It's well-positioned in a sector seeing rising demand for protection and long-term savings.
💰 Financials:
Steady annual growth in premium income, a consistent solvency ratio above regulatory norms, and a healthy embedded value (EV) make it fundamentally stable. Profit margins have remained resilient even in volatile markets.
🎯 Swing Setup:
Target: 3–4.5% short-term upside
Stop-loss: Just below recent swing low
Trend: Positive
Volume: Gradually building
Retracement: Holding key support zones
📈 A compact swing opportunity — best tracked on Excel for SL, target, and position sizing.
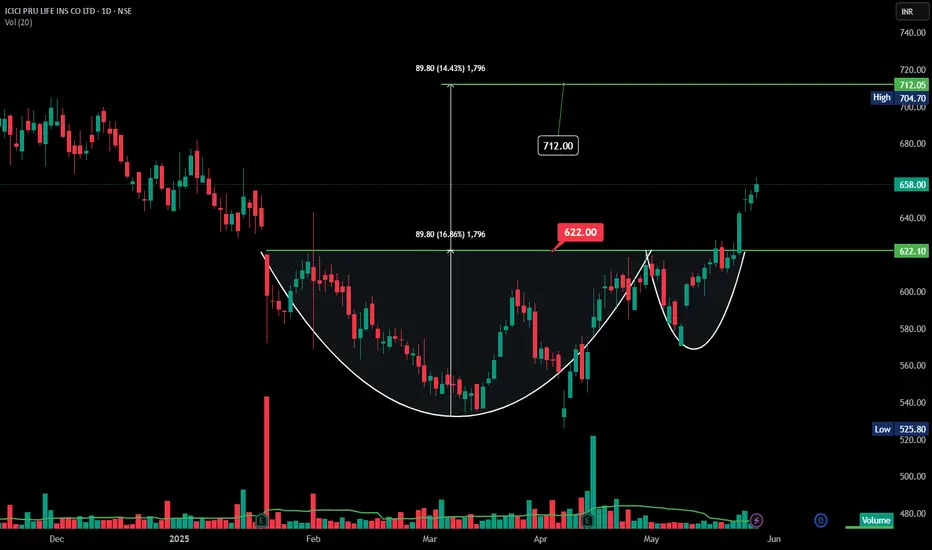
ICICIPRULI | Cup and Handle | Breakout | DailyHere's the **technical analysis** for **ICICI Prudential Life Insurance (ICICIPRULI)**
---
### 📝 **Technical Analysis – ICICI Pru Life (Daily Timeframe)**
**Pattern Identified:** ✅ *Cup and Handle Breakout*
---
### 1. **Chart Pattern Overview**
* A **classic Cup and Handle pattern** has formed and confirmed a breakout.
* The breakout happened above the **₹622** resistance level — this is now a **support**.
* The pattern signals a **bullish continuation**, with increased demand post-breakout.
---
### 2. **Volume Analysis**
* Volume spiked significantly during the breakout from the handle, suggesting strong **institutional participation** and high conviction buying.
* Volume > 850K, well above the 20-day average — a **positive confirmation**.
---
### 3. **Price Action & Strength**
* Stock is currently trading at **₹658**, comfortably above the breakout zone.
* Strong follow-up candles indicate **momentum continuation**.
* No signs of bearish reversal or heavy profit booking.
---
### 4. **Target Projection**
* **Cup Depth** = ₹89.80
* **Breakout Point** = ₹622
* **Target Price** = ₹622 + ₹89.80 = **₹712.00**
➤ Potential upside: **8%** from current levels
---
### 5. **Support & Stop-loss**
* **Support** = ₹622 (previous resistance)
* **Aggressive Stop-loss** = ₹640
* **Conservative Stop-loss** = Below ₹622
---
### 6. **Trend & Sentiment**
* Overall trend is **bullish**, and the stock has broken out of a multi-month consolidation.
* Sentiment is turning favorable with improving volumes and structure.
---
### ✅ **Conclusion**
* **Pattern**: Cup and Handle Breakout
* **Target**: ₹712
* **Current Price**: ₹658
* **Support**: ₹622
* **Action**: **Buy on dips**, with SL below ₹622 for swing targets.
---
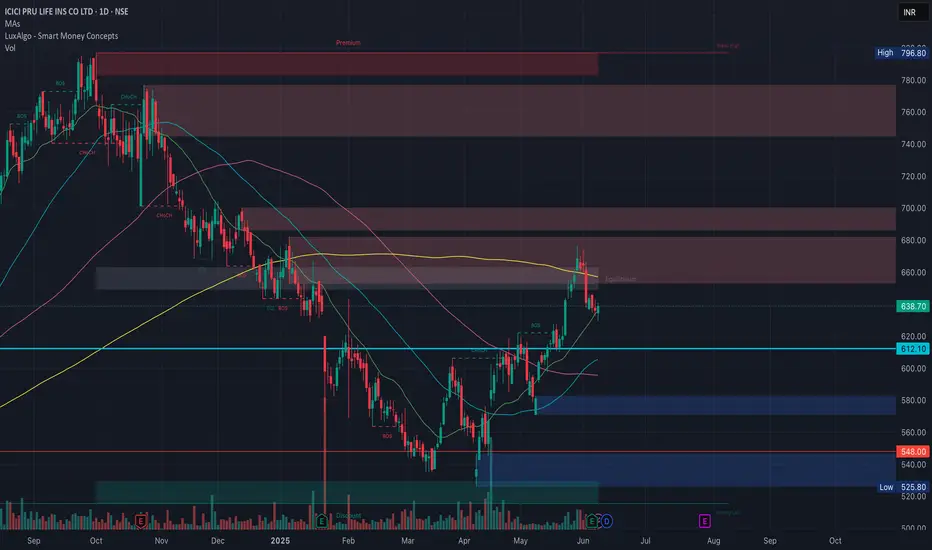
ICICI Prudential Life Insurance (ICICIPRULI) weekly chart**ICICI Prudential Life Insurance (ICICIPRULI)**
📝 **Trade Setup:**
* **Current Price:** ₹659.00
* **Trend:** Price has respected a long-term ascending trendline and is bouncing from a key support zone (\~₹620).
* **Structure:** Price formed a higher low and is showing bullish momentum with a strong green candle this week.
* **Key Levels:**
* **Support:** ₹621.90 (previous demand zone)
* **Resistance/Target 1:** ₹798.30 (previous swing high and likely supply zone)

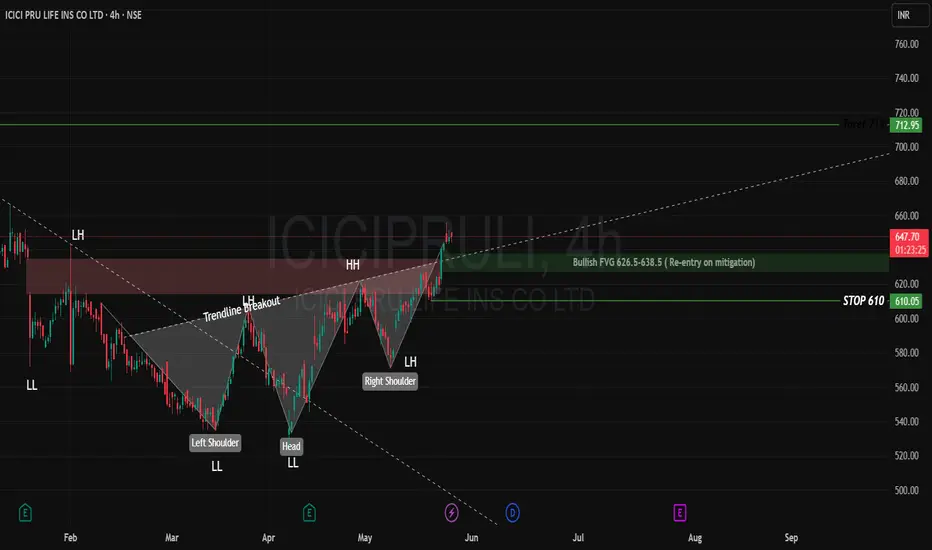
Technical Chart Analysis: ICICI Pru (CMP ₹647.20) ~ 10%Pattern Summary
Inverse H&S Pattern
Left Shoulder: ₹535
Head: ₹525
Right Shoulder: ₹571
Neckline/Breakout: ₹631 (Confirmed breakout zone)
Target (Projected): ₹712 (Measured move aligns with pattern height)
Trendline Breakout
Confirms bullish momentum post-H&S breakout.
Price has cleared previous LH (Lower High) zones — trend bias shifting bullish.
Candlestick Insight: Inverted Hammer at CMP ₹647
Appears after a rally, signals potential short-term exhaustion or pullback.
Not a reversal on its own, but if followed by a red candle, can suggest short-term retracement.
Occurs near resistance (~₹650) — caution for overbought levels in short term.
Support Zones
Bullish Fair Value Gap (FVG): ₹626.5 – ₹638.5
Re-entry opportunity upon mitigation (price retracing to fill the gap).
Well-aligned with neckline retest (₹631) — a textbook retest-and-go scenario.
Stop-loss Region: ₹610 (Below the neckline and structure support).
Disclaimer: lnkd.in
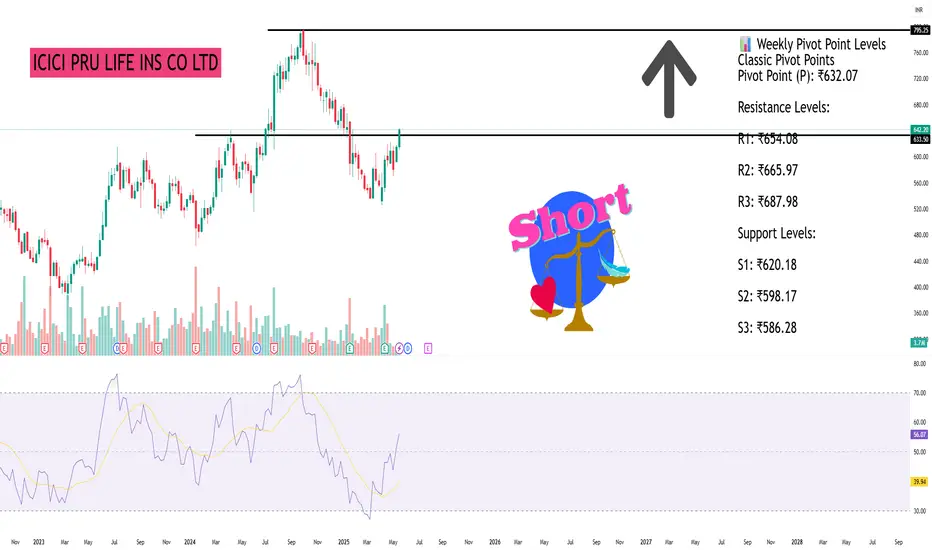
ICICI PRU LIFE INS CO LTDAs of May 26, 2025, ICICI Prudential Life Insurance Co. Ltd. (NSE: ICICIPRULI) closed at ₹642.20, marking a 3.62% increase from the previous session. Here's a detailed analysis of its weekly support and resistance levels based on various pivot point methodologies:
📊 Weekly Pivot Point Levels
Classic Pivot Points
Pivot Point (P): ₹632.07
Resistance Levels:
R1: ₹654.08
R2: ₹665.97
R3: ₹687.98
Support Levels:
S1: ₹620.18
S2: ₹598.17
S3: ₹586.28
Fibonacci Pivot Points
Pivot Point (P): ₹632.07
Resistance Levels:
R1: ₹645.02
R2: ₹653.02
R3: ₹665.97
Support Levels:
S1: ₹619.12
S2: ₹611.12
S3: ₹598.17
Camarilla Pivot Points
Pivot Point (P): ₹632.07
Resistance Levels:
R1: ₹645.31
R2: ₹648.42
R3: ₹651.52
Support Levels:
S1: ₹639.09
S2: ₹635.99
S3: ₹632.88
🔍 Technical Outlook
Trend Analysis: The stock is currently trading above its central pivot point (₹632.07), indicating a bullish bias.
Key Resistance: A breakout above ₹654.08 (R1) could signal further upward momentum.
Key Support: A decline below ₹620.18 (S1) may suggest a potential bearish reversal.
NSE: ICICIPRULI Nears Key Resistance – Breakout Ahead?ICICIPRULI (NSE: ICICIPRULI) is consolidating near a critical resistance level of ₹606. For a bullish setup:
🔹 Trigger: Wait for a strong green candle closing decisively above ₹606 with elevated volume to confirm bullish conviction.
🔹 Targets: ₹643 (Initial) → ₹668 (Mid-Term) → ₹701 (Extended) → ₹776 (Final Target).
🔹 SL: Low of the breakout candle (strict risk management).
Why This Works:
Pure price-action strategy: Focus on key levels and volume-driven momentum.
Clear risk-reward hierarchy: Final target aligns with historical swing extensions.
This post is for educational/informational purposes only and not financial advice. Trading stocks/derivatives carries high risk. Past performance does not guarantee future results. Always conduct your own research and consult a licensed financial advisor before trading. The author assumes no responsibility for losses incurred based on this content.

ICICI Pru Life Insurance Co Ltd - Further downward Correction ICICI Pru Life Insurance Co Ltd - Further downward Correction pending
It is one of the top tier interesting stock to analyze by Elliot Wave. It's Unique way of movement, makes it most interesting and amazing.
It has been moving in a channel from 2016 till today 2025 - 9 years.It has a repetive pattern of moving in ABC formations always. Anyway - All stocks move that way, but cycle are very big to see them in real life. But it is happening in short term in this stock.
The stock had hit the highest value of 800 and from there it has corrected contnuously till 574, total 226 points down in 5 months, i.e. 45 points down movements per month.
We find that it has expected move pending till 525 ish. It is Possible that market may move further down for 2 months to reach target before moving up in monthly chart.

ICICIPRU looks for a much needed upmove**Technical Analysis:**
- Taking support on weekly timeframe
-Solid long term support
- RSI says stock Oversold
- Volume starts building up
**Trading Setup**
- Buy half of quantity now cmp 600-605 and half above 640
- Target would be :700-750-800
- SL would be : 560

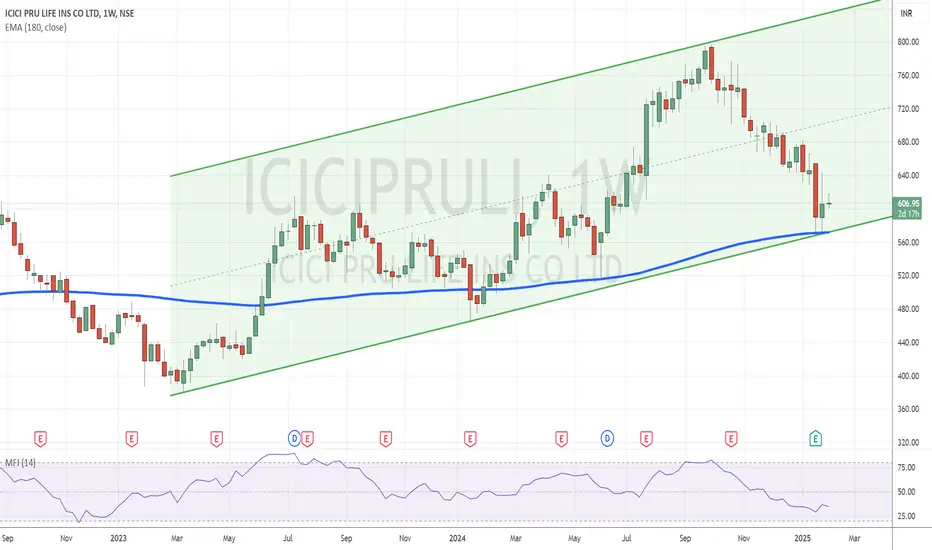
ICICI Prudential: Oversold and Poised for Recovery Topic Statement: ICICI Prudential Life Insurance has made a healthy correction, positioning itself near strong support levels within an up-trending channel.
Key Points:
1. The company reported a robust 43% profit growth QoQ.
2. The price is moving in an up-trending channel, providing clear trading opportunities.
3. The stock is taking support at the lower end of the channel, indicating oversold conditions.
4. The price is near the 180-day moving average, reinforcing the oversold status.
5. Weekly MFI is at 34 which also indicates the price being oversold.
SWING (KEEP WATCH) - ICICI PRU LIFE
Scipt already in downtrend showing LOWER LOW LOWER HIGH displaying high weakness reached major support area of 580 . If momentum continues can test major support area of 520-500

ICICI PRU LI - Approaching SupportStock after 3 months of bearishness finally approaching at the area of its strongest support
620 - 640 can be assumed as an area of high confluence as well as strong support
Stock may possible go sideways for a few days before finally taking off again to reach its first target of 690 and second target of 790
Keeping an advance alert for the approaching price range

ICICIPRULI and the 200 DEMA - LOW RISK SET UPCMP: 675
TF: Daily
200 DEMA is offering good base/support.
triangle Breakout target and channel top are possible targets on the upside.
A low risk entry opportunity. SL can be close below 660 on Daily TF.
I am not a SEBI registered Analyst. Views are personal and for educational purpose only. Please consult your Financial Advisor for any investment decisions.

ICICI Prudential Cmp 700 Price Rise with VolumesICICI Prudential Cmp 700 dated 29-11-2024
1. Consolidation Bo above 702
2. Made almost 20% correction from highs
3. RSI reversal
4. Price Rise with Volumes
Buy above 702 SL 665 target 710-720-730-745-755-765-770
It is just a view, please trade at your own risk.

ICICI PRU LIFE CONSOLIDATION AT ATH SHOWING STRONG PRICE ACTIONThe Stock has broken its ATH and Consolidating even in this market.
Has taken a perfect rebound and tested its Support
Looks for a min 30% Upmove.

ICICI PRU LIFE#icicipruli *
Trade type- all time high
Timeline-15 days
Target potential - 250 ruppe/19%
$ pattern - reverse head and sholder
And cup and handle with elliot wave 12345 etc..Multiple pattern see in ine
► fii/dii makes ath...
Key points-
Entry - 750
9o sl-735
Target- 999/1000/1200
U can also hold long term

VIEW ON ICICIPRULIGood chart structure
After quarterly updates stock has shown a good move
It can held the stock towards new high after crossing a small hurdle of 771
target 795/820
Stop loss 748
I am just representing my views
For educational purpose only.


Iciciprulife - BullishStock at support cum flip zone
760-770 fine pullback area as per fibb
It may bounce from here
So can be traded with small Sl
Risk reward seems to be excellent
Any move below 760 will take the stock upto 740
upside 790-800 temporary resistance

ICICI pru good rounding bottomIciciPru good rounding bottom & 3 years breakout. Keep in radar. Targets are big, gradually till 1040 levels. 725-750 is good accumulation zone.
Keep this in mind. Options is a dangerous instrument to play. Please do not go wild on anything unless you know exactly what you doing. Even though your direction is right still you tend to loose in option buying. And market can always prove me wrong and i take that rights too. Experience traders also fail in this market. Only risk management will give you an edge. Don’t take any trades without SL. Respect the market, Ungli nahi katoge to pura hath katna padega. Beware.
DISCLAIMER: I AM NOT SEBI REGISTERED ANALYST. ALL POSTS ARE EDUCATIONAL PURPOSES.NON ADVISORY, DISCRETIONAL NO CLAIMS, RIGHTS RESERVED. I AM NOT RESPONSIBLE FOR YOUR PROFIT OR LOSS.

ICICI Prudential Life Insurance - STOCK Analysis
ICICI Prudential Life Insurance - STOCK Analysis
This chart of ICICI Prudential Life Insurance (NSE) shows a strong bullish recovery:
Key Observations:
Current Price:
The stock is trading at ₹767.60, down by ₹1.75 (-0.23%) for the day.
Rectangle Pattern:
The chart displays a double bottom pattern, similar to the previous chart of HDFC Life, where the price declined significantly twice and then bounced back.
The highlighted box shows the price drop of ₹327.65 (-45.51%) and the subsequent recovery.
Price Projection:
The projected price move is indicated by the blue arrow, suggesting a 44.48% upside from the current levels, with a target price of around ₹1,100.
Volume (CVD - Cumulative Volume Delta):
The CVD shows 92.16K, indicating strong buying momentum, which reinforces the bullish trend.
Fundamental Analysis of ICICI Prudential Life Insurance:
Strong Market Position:
ICICI Prudential Life is one of the largest life insurance companies in India, holding a significant market share with a wide customer base. It has a robust distribution network through ICICI Bank branches and other channels.
Profitability:
Net Premium Growth: The company has been recording steady growth in its premium collection, showing resilience despite market volatility.
Solvency Ratio: As an insurance company, ICICI Pru Life maintains a strong solvency ratio, which is essential for long-term growth and policyholder trust.
Investment Portfolio:
Insurance companies heavily invest in various financial instruments, and ICICI Pru has a balanced and diversified portfolio in equity and debt markets. This helps in managing the risks associated with market fluctuations and improving returns.
Competitive Edge:
Technological Adoption: ICICI Pru has been leveraging technology to improve customer experience, with innovations in policy issuance, claims processing, and online platforms.
Risks:
Interest Rate Sensitivity: Like all insurers, ICICI Pru’s performance is linked to interest rates. Rising rates could affect investment portfolios and policyholder returns.
Regulatory Changes: Changes in insurance regulations could impact the company’s operations and profitability.
Overall Analysis:
The technical chart suggests a strong bullish trend, with a potential upside of 44.48% if the projected pattern completes.
Fundamentally, ICICI Prudential Life is in a solid position with stable financials, market leadership, and technology-driven growth.
Long-term investors may consider this stock given its strong fundamentals and technical signals. However, investors should monitor macroeconomic factors like interest rates and insurance regulations.

ICICI Prudential Life Insurance Company Limited (ICICIPRULI) Overview
ICICI Prudential Life Insurance Company Limited (NSE: ICICIPRULI) is currently navigating through an ascending channel, as shown in the 3-hour chart. It’s like watching a circus performer carefully walk a tightrope – thrilling, but you never know which way it will go!
Technical Pattern: Ascending Channel
The price action of ICICIPRULI has been steadily climbing within the confines of an ascending channel. This pattern is characterized by higher highs and higher lows, creating a channel where the price is currently dancing near the upper boundary.
Channel Resistance: The upper boundary, currently acting as resistance, is approximately near ₹770-₹775.
Channel Support: The lower boundary, providing support, is hovering around ₹735-₹740.
Current Price: ₹768.00 (as of the last candle close)
Volume: 97.709K – indicating moderate trading activity, almost like the audience holding their breath as they watch the performer’s next move.
Price Action Analysis
ICICIPRULI’s price has recently tested the upper boundary of the ascending channel, but couldn’t muster the strength to break out. This is like trying to reach the top shelf without a stool – so close, yet so far! The price has pulled back slightly, hinting at a potential consolidation before the next big move.
What to Watch For
Breakout or Breakdown?: The key question is whether ICICIPRULI will break above the channel's resistance or succumb to the support line. A breakout could lead to a bullish run, while a breakdown might see the stock tumble towards lower levels.
Volume Confirmation: Watch the volume closely. A breakout with strong volume could confirm the move. On the other hand, if the price breaks down with increased volume, it could signal a bearish shift.
RSI and Other Indicators: Keep an eye on RSI and other momentum indicators to gauge the strength of the current trend.
Possible Scenarios
Bullish Scenario: If ICICIPRULI breaks above the channel resistance with significant volume, it could head towards the next resistance levels around ₹800-₹810.
Bearish Scenario: If the stock fails to hold the channel support and breaks down, we could see a pullback towards ₹735 or even lower.
Conclusion
ICICI Prudential Life Insurance Company Limited is at a critical juncture, much like that tightrope walker deciding whether to step forward or retreat. While the ascending channel provides a structured path, the real question is – will the stock perform a grand finale with a breakout, or take a cautious step back? Stay tuned, and remember to enjoy the show while keeping an eye on those risk management strategies!
