BUY TODAY SELL TOMORROW for 5%DON’T HAVE TIME TO MANAGE YOUR TRADES?
- Take BTST trades at 3:25 pm every day
- Try to exit by taking 4-7% profit of each trade
- SL can also be maintained as closing below the low of the breakout candle
Now, why do I prefer BTST over swing trades? The primary reason is that I have observed that
Indo Count Industries Limited
No trades
Next report date
—
Report period
—
EPS estimate
—
Revenue estimate
—
5.70 INR
2.46 B INR
38.17 B INR
66.70 M
About Indo Count Industries Limited
Sector
Industry
Website
Headquarters
Mumbai
Founded
1988
IPO date
Nov 7, 1990
Identifiers
2
ISIN INE483B01026
Indo Count Industries Ltd. engages in the manufacturing and export of bedding, quilts, pillows, sleeping bags; and offers preparation and spinning of cotton fibers. Its products include bed sheet, fashion, utility, and institutional bedding. The company brands include Revival, Pure Collection, Boutique Living, Harlequin, Sanderson, and Scion. It operates its business through the textile segment. The company was founded by Anil Kumar Jain on November 7, 1988 and is headquartered in Mumbai, India.
Related stocks

Unlocking Chart Vision: Why One Breakout Isn’t EnoughRetail traders often gravitate towards the familiar—you’ll notice on the right chart, a classic breakout above the counter trendline (CT) is the “go-to” setup most focus on. This approach is common, but it can signal limited experience or a lack of exposure to complex, multi-pattern scenarios.
As a

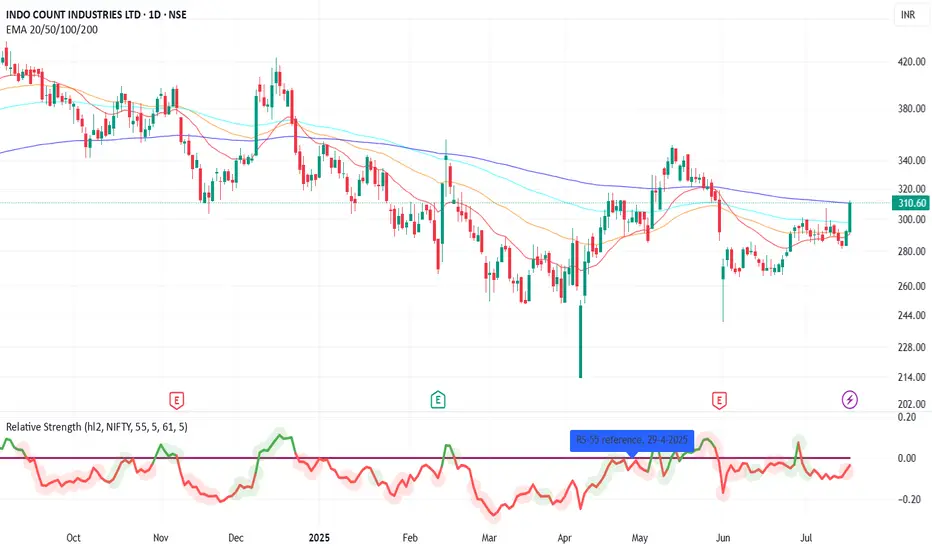
ICIL - Indo Count on the verge of breakoutIndo count is on the verge of a breakout. Indications are coming in various ways that stock is gearing up for a big breakout . Today , Stock price was closed crossing the previous month high of 301.05 by 3.17%. Stock has formed a bullish candle ,Stock volume increased by 13.4 times vs 5 day average.
BUY TODAY SELL TOMORROW for 5%DON’T HAVE TIME TO MANAGE YOUR TRADES?
- Take BTST trades at 3:25 pm every day
- Try to exit by taking 4-7% profit of each trade
- SL can also be maintained as closing below the low of the breakout candle
Now, why do I prefer BTST over swing trades? The primary reason is that I have observed that

ICIL🚀 Breakout Alert: Indo Count Industries Ltd (ICIL) 🚀
📈 A strong breakout from a rising channel pattern on the 3-month chart!
✅ Entered at ₹390 with 150 QTY.
📊 Targeting ₹531.70, with the recent high of ₹450.65 as a crucial resistance to watch.
🕒 Volume surging, signaling strong momentum!

Indo Count Industries LtdDate 13.10.2024
Indo Count Industries
Timeframe : Day chart
Healthy Fundamentals ::
Market Cap ₹ 7,159.66 Cr II Enterprise Value ₹ 7,986.50 Cr
No. of Shares 19.81 Cr II P/E 21.56
P/B 3.37 II Div. Yield 0.61 %
Book Value (TTM) ₹ 107.37 II CASH ₹ 87.25 Cr
DEBT ₹ 914.09 Cr II Promoter Holding

ICIL | Consolidating channel breakout | Short Swing TradeICIL | Consolidating channel breakout | Short Swing Trade
Chart Analysis
1) Consolidating channel breakout
2) wedge pattern formation
3) EMA - 50 support and good volume sign
Stock will try to catch up the momentum and reach the previous highest point which is about 10% growth in next week or two.

ICIL- Wedge Pattern with Strong Support from Bollinger Bands✅ The stock is showing signs of a bullish breakout from a descending wedge pattern. The recent move above ₹409 suggests a potential continuation of the upward trend as the stock attempts to break out of the wedge formation.
✅ The ascending trendline has acted as solid support for the stock since Fe


ICIL (4HR)ICIL (4HR)
Indo Count Industries Limited
CMP 407
Previous resistance break and retest done

See all ideas
Summarizing what the indicators are suggesting.
Neutral
SellBuy
Strong sellStrong buy
Strong sellSellNeutralBuyStrong buy
Neutral
SellBuy
Strong sellStrong buy
Strong sellSellNeutralBuyStrong buy
Neutral
SellBuy
Strong sellStrong buy
Strong sellSellNeutralBuyStrong buy
An aggregate view of professional's ratings.
Neutral
SellBuy
Strong sellStrong buy
Strong sellSellNeutralBuyStrong buy
Neutral
SellBuy
Strong sellStrong buy
Strong sellSellNeutralBuyStrong buy
Neutral
SellBuy
Strong sellStrong buy
Strong sellSellNeutralBuyStrong buy
Displays a symbol's price movements over previous years to identify recurring trends.
Frequently Asked Questions
The current price of ICIL is 303.40 INR — it has decreased by −0.26% in the past 24 hours. Watch Indo Count Industries Limited stock price performance more closely on the chart.
Depending on the exchange, the stock ticker may vary. For instance, on NSE exchange Indo Count Industries Limited stocks are traded under the ticker ICIL.
ICIL stock has risen by 0.14% compared to the previous week, the month change is a 20.91% rise, over the last year Indo Count Industries Limited has showed a −11.01% decrease.
We've gathered analysts' opinions on Indo Count Industries Limited future price: according to them, ICIL price has a max estimate of 523.00 INR and a min estimate of 316.00 INR. Watch ICIL chart and read a more detailed Indo Count Industries Limited stock forecast: see what analysts think of Indo Count Industries Limited and suggest that you do with its stocks.
ICIL reached its all-time high on Jul 2, 2024 with the price of 450.65 INR, and its all-time low was 0.50 INR and was reached on Mar 3, 2009. View more price dynamics on ICIL chart.
See other stocks reaching their highest and lowest prices.
See other stocks reaching their highest and lowest prices.
ICIL stock is 6.73% volatile and has beta coefficient of 2.44. Track Indo Count Industries Limited stock price on the chart and check out the list of the most volatile stocks — is Indo Count Industries Limited there?
Today Indo Count Industries Limited has the market capitalization of 60.10 B, it has increased by 7.32% over the last week.
Yes, you can track Indo Count Industries Limited financials in yearly and quarterly reports right on TradingView.
Indo Count Industries Limited is going to release the next earnings report on May 30, 2026. Keep track of upcoming events with our Earnings Calendar.
ICIL net income for the last quarter is 244.29 M INR, while the quarter before that showed 390.26 M INR of net income which accounts for −37.40% change. Track more Indo Count Industries Limited financial stats to get the full picture.
Yes, ICIL dividends are paid annually. The last dividend per share was 2.00 INR. As of today, Dividend Yield (TTM)% is 0.66%. Tracking Indo Count Industries Limited dividends might help you take more informed decisions.
Indo Count Industries Limited dividend yield was 0.79% in 2024, and payout ratio reached 16.10%. The year before the numbers were 0.62% and 12.89% correspondingly. See high-dividend stocks and find more opportunities for your portfolio.
As of Feb 15, 2026, the company has 7.16 K employees. See our rating of the largest employees — is Indo Count Industries Limited on this list?
EBITDA measures a company's operating performance, its growth signifies an improvement in the efficiency of a company. Indo Count Industries Limited EBITDA is 3.95 B INR, and current EBITDA margin is 5.73%. See more stats in Indo Count Industries Limited financial statements.
Like other stocks, ICIL shares are traded on stock exchanges, e.g. Nasdaq, Nyse, Euronext, and the easiest way to buy them is through an online stock broker. To do this, you need to open an account and follow a broker's procedures, then start trading. You can trade Indo Count Industries Limited stock right from TradingView charts — choose your broker and connect to your account.
Investing in stocks requires a comprehensive research: you should carefully study all the available data, e.g. company's financials, related news, and its technical analysis. So Indo Count Industries Limited technincal analysis shows the strong buy rating today, and its 1 week rating is buy. Since market conditions are prone to changes, it's worth looking a bit further into the future — according to the 1 month rating Indo Count Industries Limited stock shows the buy signal. See more of Indo Count Industries Limited technicals for a more comprehensive analysis.
If you're still not sure, try looking for inspiration in our curated watchlists.
If you're still not sure, try looking for inspiration in our curated watchlists.