IDBI Bank an opportunity to play disinvestment by Government IDBI Bank – Multi-Timeframe Technical View blended with disinvestment opportunity.
IDBI Bank is trading near ₹99.8, testing a crucial long-term resistance zone around ₹100, visible on monthly and weekly charts. On the monthly timeframe, the stock has formed a strong rounded bottom from the ₹35–40 z
IDBI Bank Limited
No trades
8.63 INR
76.31 B INR
341.48 B INR
5.86 B
About IDBI Bank Limited
Sector
Industry
CEO
Rakesh Sharma
Website
Headquarters
Mumbai
Founded
1964
Identifiers
2
ISININE008A01015
IDBI Bank Ltd. engages in the provision of commercial banking services to retail and corporate customers. It operates through the following segments: Corporate and Wholesale Banking; Retail Banking; Treasury; and Other Banking and Group Operations. The Corporate and Wholesale Banking segment includes corporate relationship covering deposit and credit activities other than retail, as well as corporate advisory and syndication, project appraisal, and investment portfolio. The Retail Banking segment comprises of credit and deposit activities that are primarily oriented towards individuals and small business including priority sector lending. The Treasury segment trades portfolio of investments, money market operations, derivative trading, and foreign exchange operations on the proprietary account and for customers. The Other Banking and Group Operations segment Includes operations and activities of group companies other than bank. The company was founded on July 01, 1964 and is headquartered in Mumbai, India.
Related stocks

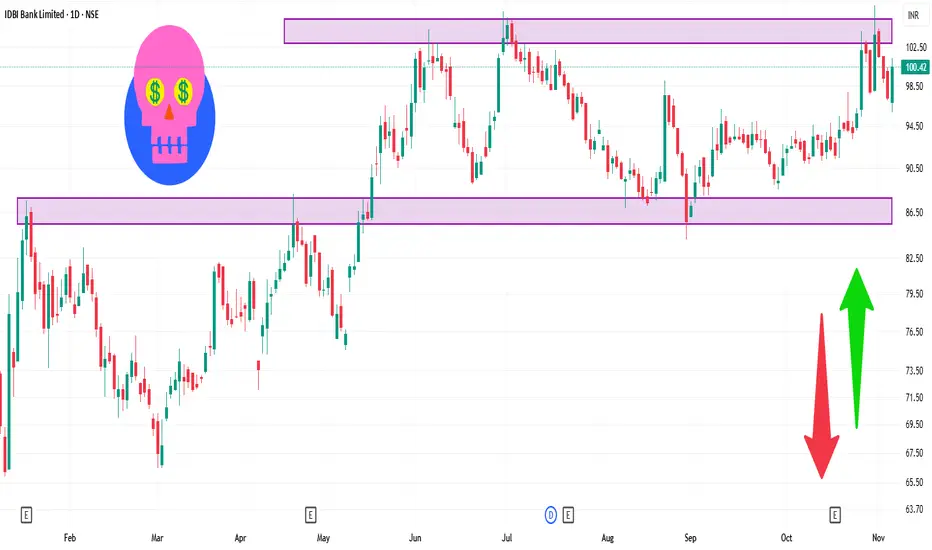
IDBI 1 Week TIme Frame ✅ Key Levels
Support zone: ~ ₹99.30 and ~ ₹98.35.
Pivot / neutral price: ~ ₹100.94.
Resistance zone: ~ ₹101.89 and then ~ ₹103.53-₹104.48.
🎯 Watch-for This Week
A break above ~₹101.90 could unlock upside toward ~₹103.50/₹104.50.
A break below ~₹98.35 would signal increased weakness and could t

Multi year breakout in IDBIRBI has given clearance for the bid and it remains to be seen who ends up as winner. If its Kotak bank which looks like huge possibility, in quarters to come we should see re rating in P/BV for the stock

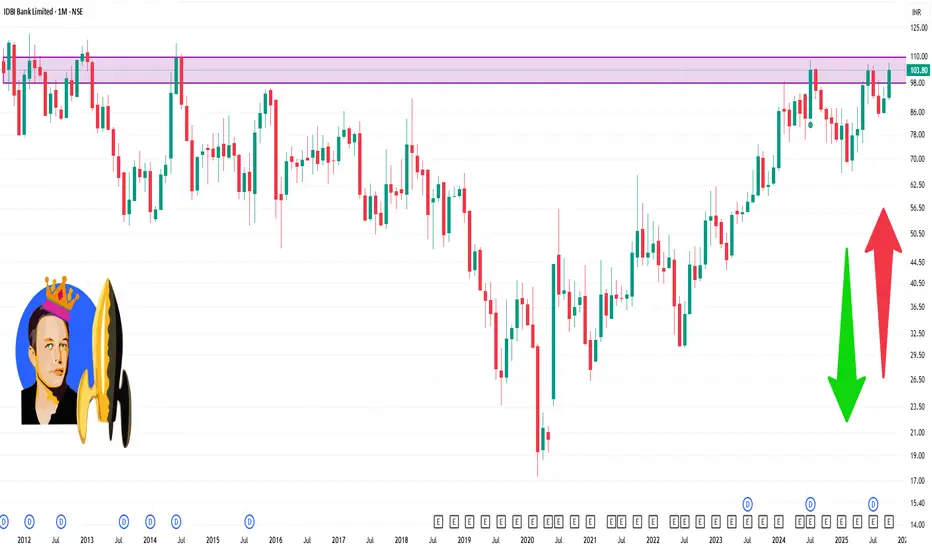
IDBI Bank cmp 104.62 by Monthly Chart viewIDBI Bank cmp 104.62 by Monthly Chart view
- Support Zone at 64 to 84 Price Band
- Resistance Zone at 108 to 128 Price Band
- Breakout attempted from Falling Resistance Trendline
- Bullish Head and Shoulders by the Resistance Zone neckline
- Monthly Volumes spiking regularly over a year since Sept

IDBI Bank Weekly Chart Analysis1. Major Chart Pattern – Cup & Handle Formation
Your chart clearly highlights a large Cup & Handle pattern forming over ~14–16 months:
Cup
Bottom near ₹68–₹70
Smooth rounding structure → bullish accumulation phase
Strong reversal back toward previous highs
Handle
A smaller, shallow retracemen

IDBI 1 Day Time Frame Current price: ~ ₹99.26.
Day’s trading range: ₹98.80 – ₹101.51.
52-week range: ₹65.89 – ₹106.97.
IDBI Bank and the Bullish Cup & Handle Pattern📈 Technical Analysis Spotlight: IDBI Bank and the Bullish Cup & Handle Pattern
In the world of technical analysis, chart patterns often serve as powerful indicators of potential price movements. One such pattern, the Cup and Handle, has recently emerged on the daily chart of IDBI Bank Limited, offer

IDBI BANK, Kindly do your own studyThis stock is in momentum in higher time frame.
5 monthly its in momentum
5 monthly MACD PCO and above zero line
5 monthly RSI is above 60
Monthly stock is in momentum and challenging upper bollinger band and stock is above 50 ema
Monthly MACD gave PCO above zero line
Monthly RSI is above 60
M

IDBI 1 Month Time Frame ✅ Current snapshot
Stock is trading around ₹ 93-100 (recent levels).
52-week high ~ ₹ 106.3, 52-week low ~ ₹ 65.9.
Technical summary (monthly time-frame) shows indicators leaning “Strong Buy” overall according to one provider.
Fundamentals: P/E ~ ~10-11x, book value ~ ₹63-64 (various sources) and
BUY TODAY SELL TOMORROW for 5%DON’T HAVE TIME TO MANAGE YOUR TRADES?
- Take BTST trades at 3:25 pm every day
- Try to exit by taking 4-7% profit of each trade
- SL can also be maintained as closing below the low of the breakout candle
Now, why do I prefer BTST over swing trades? The primary reason is that I have observed that

See all ideas
Summarizing what the indicators are suggesting.
Oscillators
Neutral
SellBuy
Strong sellStrong buy
Strong sellSellNeutralBuyStrong buy
Oscillators
Neutral
SellBuy
Strong sellStrong buy
Strong sellSellNeutralBuyStrong buy
Summary
Neutral
SellBuy
Strong sellStrong buy
Strong sellSellNeutralBuyStrong buy
Summary
Neutral
SellBuy
Strong sellStrong buy
Strong sellSellNeutralBuyStrong buy
Summary
Neutral
SellBuy
Strong sellStrong buy
Strong sellSellNeutralBuyStrong buy
Moving Averages
Neutral
SellBuy
Strong sellStrong buy
Strong sellSellNeutralBuyStrong buy
Moving Averages
Neutral
SellBuy
Strong sellStrong buy
Strong sellSellNeutralBuyStrong buy
Displays a symbol's price movements over previous years to identify recurring trends.
MIDCAPETF
Mirae Asset Nifty Midcap 150 ETF Exchange Traded Fund UnitsWeight
0.15%
Market value
214.03 K
USD
FLQA.USD
Franklin FTSE Asia ex China ex Japan UCITS ETF Accum Shs USDWeight
0.01%
Market value
52.20 K
USD
Explore more ETFs
Frequently Asked Questions
The current price of IDBI is 101.70 INR — it has decreased by −0.10% in the past 24 hours. Watch IDBI Bank Limited stock price performance more closely on the chart.
Depending on the exchange, the stock ticker may vary. For instance, on NSE exchange IDBI Bank Limited stocks are traded under the ticker IDBI.
IDBI stock has risen by 1.50% compared to the previous week, the month change is a −2.38% fall, over the last year IDBI Bank Limited has showed a 33.73% increase.
IDBI reached its all-time high on Nov 11, 2010 with the price of 202.25 INR, and its all-time low was 13.90 INR and was reached on Jan 30, 2002. View more price dynamics on IDBI chart.
See other stocks reaching their highest and lowest prices.
See other stocks reaching their highest and lowest prices.
IDBI stock is 2.55% volatile and has beta coefficient of 1.84. Track IDBI Bank Limited stock price on the chart and check out the list of the most volatile stocks — is IDBI Bank Limited there?
Today IDBI Bank Limited has the market capitalization of 1.08 T, it has decreased by −2.31% over the last week.
Yes, you can track IDBI Bank Limited financials in yearly and quarterly reports right on TradingView.
IDBI net income for the last quarter is 32.30 B INR, while the quarter before that showed 20.19 B INR of net income which accounts for 59.95% change. Track more IDBI Bank Limited financial stats to get the full picture.
Yes, IDBI dividends are paid annually. The last dividend per share was 2.10 INR. As of today, Dividend Yield (TTM)% is 2.10%. Tracking IDBI Bank Limited dividends might help you take more informed decisions.
IDBI Bank Limited dividend yield was 2.70% in 2024, and payout ratio reached 29.59%. The year before the numbers were 1.85% and 27.86% correspondingly. See high-dividend stocks and find more opportunities for your portfolio.
As of Dec 24, 2025, the company has 19.73 K employees. See our rating of the largest employees — is IDBI Bank Limited on this list?
Like other stocks, IDBI shares are traded on stock exchanges, e.g. Nasdaq, Nyse, Euronext, and the easiest way to buy them is through an online stock broker. To do this, you need to open an account and follow a broker's procedures, then start trading. You can trade IDBI Bank Limited stock right from TradingView charts — choose your broker and connect to your account.
Investing in stocks requires a comprehensive research: you should carefully study all the available data, e.g. company's financials, related news, and its technical analysis. So IDBI Bank Limited technincal analysis shows the strong buy rating today, and its 1 week rating is strong buy. Since market conditions are prone to changes, it's worth looking a bit further into the future — according to the 1 month rating IDBI Bank Limited stock shows the buy signal. See more of IDBI Bank Limited technicals for a more comprehensive analysis.
If you're still not sure, try looking for inspiration in our curated watchlists.
If you're still not sure, try looking for inspiration in our curated watchlists.