IDFC First Bank - BreakoutHello All,
Greetings!
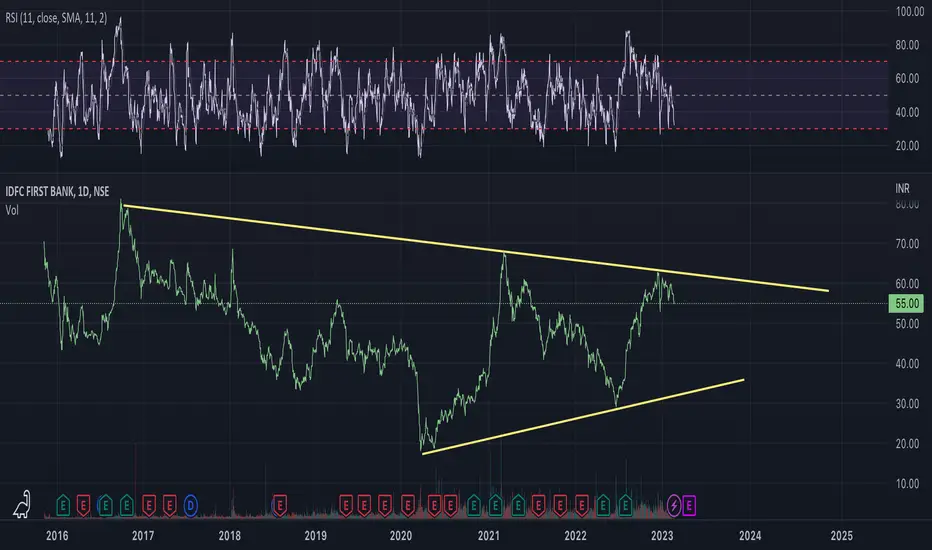
IDFC Bank Shows Breakout
it has been very clear that IDFC Banks Chart shows clear breakout from from Downtrend Triangle Pattern.
Important Things
1. This is only for educational purposes only.
2. Never over trade.
3. Always keep Stop Loss.
4. Trade in limited quantity.
5. Taking a small loss is better than wiping up your capital.
I hope you found this idea helpful.
Please like and comment.
Share with Your Friends.
Keep Learning,
Happy & Safe Trading
IDFCFIRSTB trade ideas

Descending triangle breakout in IDFC First BankChart -> IDFC First Bank Daily
IDFC First Bank has given a Descending Triangle breakout with volume.
CMP: 57
Good range: 54 to 56
Targets: 61, 64
SL: 53.50 daily close
Disclaimer: This is for educational purposes only, not any recommendations to buy or sell. As I am not SEBI registered, please consult your financial advisor before taking any action.

IDFC first BankIDFC first Bank trading in triangle range. It faced Major resistance 64. if correction exist it may test 35 soon as per tringle pattern.

Long term trend break out in IDFC first bankBuy IDFC first bank between 40 and 42 for targets of 45/50 and 55 and Stop loss is 39

IDFCFIRSTBANK IN BEARISH MODELook weak chart of IDFCFIRST BANK. Stock is always rejecting from the marked TL & forming lower low on regular intervals. Looking more bearish if stock BD the support level. Expecting 45-40 in coming days if support broken.This is for your educational purpose only.


IDFCFIRST BANK short Term SetUp .1. IDFCFIRST BANK forming Falling Channel which is going to Breakout Sooner Or Later .
2. Can Possibly Test Fib 0.382 Level Before Breaking Out . So First Buying Zone Will be Fib 0.382 Level (details given in chart).
3. Fib 0.50 Level is coinciding with Important Support Level Of 46.50 ( which will be our second buying zone ) . if you get chance Buy here .
4. Place Sell order After buying @ 60 and Enjoy the Profit.
5. Mandatorily Use Trailing Stoploss to secure your Profits.
Signal Duration - 10 days to 45 days
NSE:IDFCFIRSTB
Disclaimer :- Please DYOR before Investing.

LONG CALL ON IDFC FIRST BANKLooking good can buy IDFC FIRST BANK
It has broken yesterday's high and gave a closing above it.
Targets 58/59.50
Stop loss 54
I am just representing my views.
For educational purpose only.

IDFC FIRST --SWING TRADE --28/02/2023IDFC FIRST BANK --SWING TRADE --28/02/2023
1. stock seen lower channel breakout last hourly candle
2. support form around 54 level and move above 21, 44 HMA on hourly chart
3. BUY near 55 LEVEL target 56-57-58 ( 1-2) session stop loss bellow 53.25 level
4. bank nifty seen some pullback from oversold level
5. CCI , ema crossover seen .
** THIS IDEA IS EDUCATIONAL PURPOSE ..trade at own risk ..
HAPPY TRADING .!!

IDFC First IDFC First .. Failed to complete double bottom pattern . now at strong support .. waiting for the bounce back . if it bounce back immediate target is 61 . if it breaks resistance @64 , it can reach to ATH 84 .. so im bullish on this ..

IDFCFIRST BANKFlag pattern formed in IDFCFIRST BANK on 4 h time-frame, Wai for breakout
Only for educational and knowledge purpose no any suggestions for trade

IDFC First Bank Quite similar setup to its parent IDFC ltd. Only difference is IDFC First is yet to give multiyear breakout and is hovering near the trendline on weekly timeframe.

IDFC First BankIDFC First Bank
CMP 53
Its into previous breakout zones which may act as support.
Keep an eye, may bounce a bit from current levels.

IDFC First Bank: Evening Star Pattern in a uptrend channel topIDFCFIRSTB has an Evening Star Pattern at the top of an uptrend.
Also the volume is decreasing.
And the RSI is moving downwards from overbought region.
Trade:
BUY above 64, SL: 61, T: 66/68
SELL below 60, SL: 63, T: 57/55


Daily brkout IDFCFIRST Bank luking gud with C&H pattern
immediate targate is 69 with SL 57
As holding for some time trgt is 90 and stoploss is below support line on DCLBS.
This is only for educational purpose.

IDFC FIRST BANK breakout IDFC FIRST BANK is giving a breakout of a consolidation in a weekly chart and is now ready to move towards a target of 67 Rs. in Dec month

IDFCFIRSTBANKIDFCFIRSTBANK after its superb performance in its recent innings had to face the resistance and started moving down as shown in the chart. The recent target for the stock is projected as 61. The parallel path given in the chart could be its probable journey a trader can look into with a strict stop loss.

IDFCFirstBank This is only the beginingPatience is a virtue : Wise words for every Investors.
1. It takes time for any investment to compound exponentially.
2. If you have identified a stock for investment -- Give your Research(Efforts) ,( Fundamental and Technical ) Time to deliver.
3. Learning to Trust Oneself is simply SELF TAUGHT (can't be of much help here.)
3a. Sadly a missing trait of many Investors and traders alike.
4. IDFCFirstBank is here to stay n deliver,
5. I see this happening with next 3 to 6 months.
6. Will be a part of its long growth journey ahead.
7. Will not be surprised to see its price in 3 digits and stable around there for some time.
8. Dividends are what I'm banking on from my investment here.
9. A definite MULTI BAGGER.

Testing of major ResistanceSadly not enough reputations earned to post links "sigh"
Just a casual update.
Recount done; Almost same structure.

Buy IDFC FIRST Bank (Investment Idea__SIP IDEA), Multibagger Investment Idea
Buy IDFC FIRST Bank
CMP 57. Buy on DIP. Stoploss 28 Weekly Closing Basis.
Stock is trading in Symmetrical Triangle...
Support Levels: 45,53

IDFC First Bank: Buy on dips for long termIn the NSE:IDFCFIRSTB shares, we can see the Elliot Wave pans out nicely.
See the outer wave marked in green 1-2-3. We are in the motive/impulsive 3rd wave.
Now in the motive 2nd wave, there are again 5 subwaves formation. We are at 3rd motive inner wave. So it is 3-3 wave overall.
Hence a retesting of the long term support (which is also a neckline of a rounding bottom) around 50-52 is welcome.
We can accumulate around 50-52 for a target of 65-70 (a few months timeframe) with a SL of 46.
