IEX: Stuck in the 'Coupling' CrosshairsIEX is currently a "headline-driven" stock. Despite reporting a record 13,050 MU trading volume in January 2026 (up 19.6% YoY), the share price remains suppressed. The primary culprit is the CERC’s Market Coupling directive, which threatens to dilute IEX’s 85-90% dominance in the Day-Ahead Market (D
Indian Energy Exchange Ltd.
No trades
Next report date
—
Report period
—
EPS estimate
—
Revenue estimate
—
5.39 INR
4.29 B INR
5.37 B INR
749.40 M
About Indian Energy Exchange Ltd.
Sector
Industry
Website
Headquarters
Noida
Founded
2007
IPO date
Oct 23, 2017
Identifiers
2
ISIN INE022Q01020
Indian Energy Exchange Ltd. engages in the power exchange business and provides an automated platform for trading of electricity and related products. It enables trading and price discovery of electricity and related products with risk management for participants of the electricity market. The firm's products include day-ahead-market (DAM) electricity contracts, term-ahead-market (TAM) electricity contract, Renewable Energy Certificates (REC) and Energy Saving Certificates. The company was founded on March 26, 2007 and is headquartered in Noida, India.
Related stocks

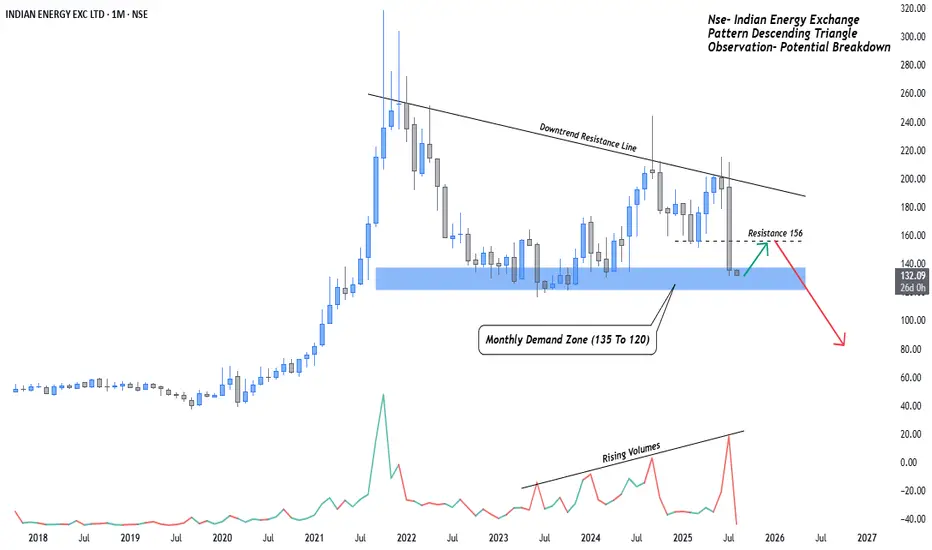
Energy Exhausted: Indian Energy Exchange Nears BreakdownGreetings Fellow Traders, Sharing a critical technical update on Indian Energy Exchange (IEX). The chart is flashing early warning signs of a potential breakdown. Key zones and price action indicate growing bearish momentum stay alert and trade with caution!
Indian Energy Exchange – Bearish Outlook
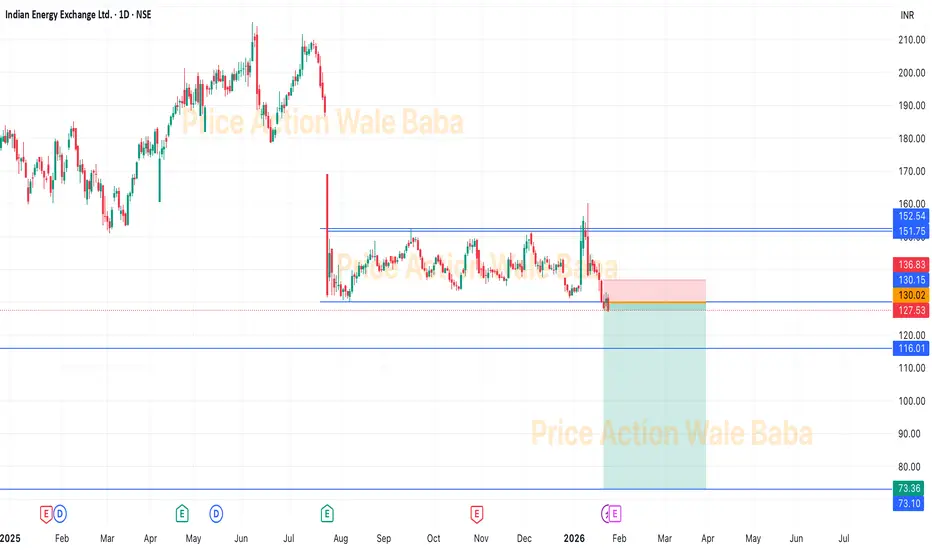
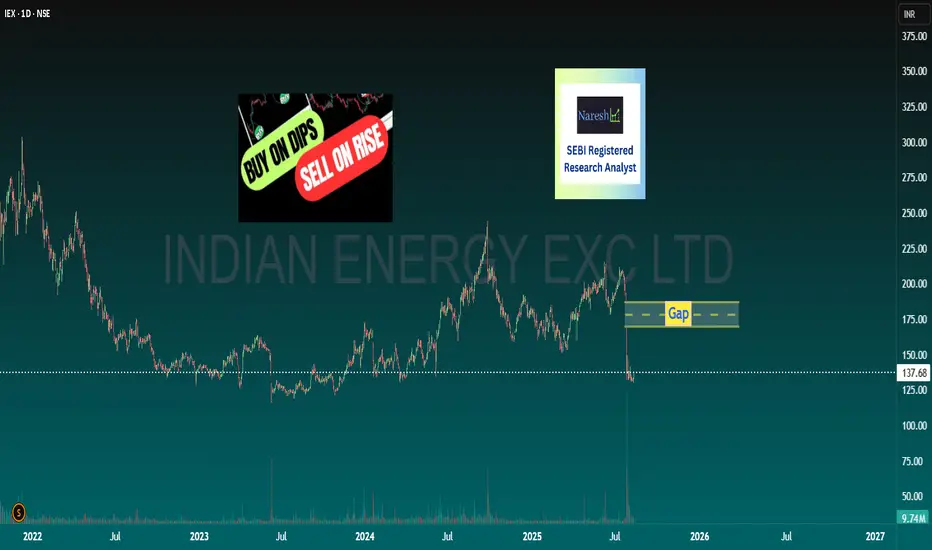
IEX - Box BreakoutIEX was consolidating in the box from the long time and now it's out of the box.
It is good to short IEX and hold for the target of 115-110
Although, you can keep in the hold for the target of 80-75 as we know government policy are comes against IEX's monopoly.
IEX 1 Month View 📊 Current Price Context (Recent 1-Month)
• Latest available quote (as of Jan 9, 2026 close): ~₹138 – ₹140.
📈 1-Month Technical Levels (Short-Term)
Key Resistance Levels (Upside)
These are levels where price may face selling pressure:
₹144 – ₹145 — Immediate resistance zone near recent moving ave

IEX 1 Day Time Frame 📊 Daily Support & Resistance (Short‑Term Levels)
Pivot‑based Daily Levels (from classical pivot calculations):
Resistance 1 (R1): ~₹145.5
Resistance 2 (R2): ~₹147.1
Resistance 3 (R3): ~₹148.2
Pivot Point: ~₹144.5
Support 1 (S1): ~₹142.9
Support 2 (S2): ~₹141.8
Support 3 (S3): ~₹140.2
➡️ These are

IEX 1 Week Time Frame 📊 Current Context
IEX is trading around ₹138–₹142 range recently.
Short‑term technical indicators show bearish bias but mixed signals overall.
📌 1‑Week Key Levels (Support & Resistance)
📈 Resistance Levels
1. ~₹142–₹143 — Immediate resistance / pivot cluster (key short term)
2. ~₹144–₹145 — Next

IEX 1 Month Time Frame 📈 Current snapshot
As of late November 2025, IEX trades around ₹139–140/share.
The 52-week range remains ~₹130.26 (low) to ~₹215.40 (high).
Recent trading has seen a dip from earlier resistance around ₹145–150 down to ~₹139.
🎯 1-Month Scenarios for IEX
Neutral / Range-bound → ₹138–145: If marke
Indian Energy ExchangeDate 04.11.2025
IEX
Timeframe : Weekly Chart
Note:
(1) Read the key notes mentioned in the chart
(2) Safe long entry only after breakout of consolidation
NEWS Update :
(1) CO ACHIEVES MONTHLY ELECTRICITY TRADED VOLUME OF 11,233 MU IN OCTOBER’25
AN INCREASE OF 16.5 % YOY
(2) ACHIEVES MONTH

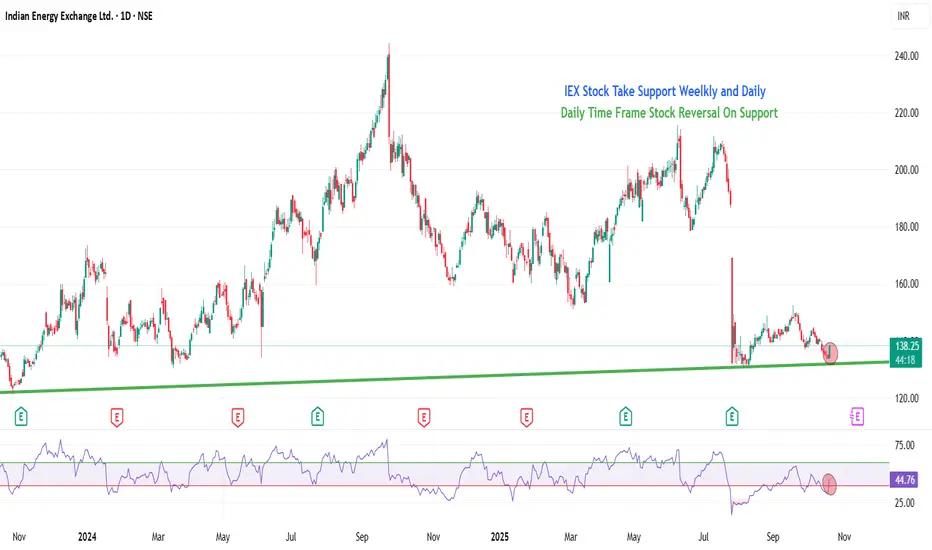
IEX STOCK Daily Time Frame Reversal On SupportSTOCK Daily Time Frame Reversal On Support
1. Price Action
The stock is trading around 138, which is exactly at its 52-week low and a historical support zone from 2021.
Bullish Candle Stick Patterns is forming at support.
2. RSI (Relative Strength Index)
RSI at 44 → has moved from oversold to buyin
Option Trade Not Advised # IEXIEX CMP 138
Buy On Dips till 120
SL CLB 115
Expected Tgt's 150-160-175-190-205-210
📌 Stick to levels. Follow discipline. Let the trade work for you.
📌Please Follow TSL (Trailing Stop Loss)
To help maximize your profits and protect gains as the trade progresses.
Let’s stay hopeful that the move c
See all ideas
Summarizing what the indicators are suggesting.
Neutral
SellBuy
Strong sellStrong buy
Strong sellSellNeutralBuyStrong buy
Neutral
SellBuy
Strong sellStrong buy
Strong sellSellNeutralBuyStrong buy
Neutral
SellBuy
Strong sellStrong buy
Strong sellSellNeutralBuyStrong buy
An aggregate view of professional's ratings.
Neutral
SellBuy
Strong sellStrong buy
Strong sellSellNeutralBuyStrong buy
Neutral
SellBuy
Strong sellStrong buy
Strong sellSellNeutralBuyStrong buy
Neutral
SellBuy
Strong sellStrong buy
Strong sellSellNeutralBuyStrong buy
Displays a symbol's price movements over previous years to identify recurring trends.
SMALLCAP
Mirae Asset Nifty Smallcap 250 Momentum Quality 100 ETF Units Exchange Traded FundWeight
1.25%
Market value
1.06 M
USD
MOCAPITAL
Motilal Oswal Nifty Capital Market ETF Exchange Traded Fund UnitsWeight
2.80%
Market value
348.84 K
USD
MIDSMALL
Mirae Asset Nifty MidSmallcap400 Momentum Quality 100 ETFWeight
0.46%
Market value
189.37 K
USD
Explore more ETFs
Frequently Asked Questions
The current price of IEX is 124.97 INR — it has increased by 0.82% in the past 24 hours. Watch Indian Energy Exchange Ltd. stock price performance more closely on the chart.
Depending on the exchange, the stock ticker may vary. For instance, on NSE exchange Indian Energy Exchange Ltd. stocks are traded under the ticker IEX.
IEX stock has risen by 2.86% compared to the previous week, the month change is a −10.74% fall, over the last year Indian Energy Exchange Ltd. has showed a −26.55% decrease.
We've gathered analysts' opinions on Indian Energy Exchange Ltd. future price: according to them, IEX price has a max estimate of 285.00 INR and a min estimate of 105.00 INR. Watch IEX chart and read a more detailed Indian Energy Exchange Ltd. stock forecast: see what analysts think of Indian Energy Exchange Ltd. and suggest that you do with its stocks.
IEX stock is 2.36% volatile and has beta coefficient of 1.39. Track Indian Energy Exchange Ltd. stock price on the chart and check out the list of the most volatile stocks — is Indian Energy Exchange Ltd. there?
Today Indian Energy Exchange Ltd. has the market capitalization of 110.18 B, it has decreased by −0.71% over the last week.
Yes, you can track Indian Energy Exchange Ltd. financials in yearly and quarterly reports right on TradingView.
Indian Energy Exchange Ltd. is going to release the next earnings report on May 30, 2026. Keep track of upcoming events with our Earnings Calendar.
IEX earnings for the last quarter are 1.30 INR per share, whereas the estimation was 1.30 INR resulting in a −0.21% surprise. The estimated earnings for the next quarter are 1.48 INR per share. See more details about Indian Energy Exchange Ltd. earnings.
Indian Energy Exchange Ltd. revenue for the last quarter amounts to 1.44 B INR, despite the estimated figure of 1.45 B INR. In the next quarter, revenue is expected to reach 1.69 B INR.
IEX net income for the last quarter is 1.19 B INR, while the quarter before that showed 1.23 B INR of net income which accounts for −3.44% change. Track more Indian Energy Exchange Ltd. financial stats to get the full picture.
Indian Energy Exchange Ltd. dividend yield was 1.71% in 2024, and payout ratio reached 62.16%. The year before the numbers were 1.86% and 63.37% correspondingly. See high-dividend stocks and find more opportunities for your portfolio.
As of Feb 16, 2026, the company has 179 employees. See our rating of the largest employees — is Indian Energy Exchange Ltd. on this list?
EBITDA measures a company's operating performance, its growth signifies an improvement in the efficiency of a company. Indian Energy Exchange Ltd. EBITDA is 4.92 B INR, and current EBITDA margin is 86.01%. See more stats in Indian Energy Exchange Ltd. financial statements.
Like other stocks, IEX shares are traded on stock exchanges, e.g. Nasdaq, Nyse, Euronext, and the easiest way to buy them is through an online stock broker. To do this, you need to open an account and follow a broker's procedures, then start trading. You can trade Indian Energy Exchange Ltd. stock right from TradingView charts — choose your broker and connect to your account.
Investing in stocks requires a comprehensive research: you should carefully study all the available data, e.g. company's financials, related news, and its technical analysis. So Indian Energy Exchange Ltd. technincal analysis shows the sell today, and its 1 week rating is sell. Since market conditions are prone to changes, it's worth looking a bit further into the future — according to the 1 month rating Indian Energy Exchange Ltd. stock shows the sell signal. See more of Indian Energy Exchange Ltd. technicals for a more comprehensive analysis.
If you're still not sure, try looking for inspiration in our curated watchlists.
If you're still not sure, try looking for inspiration in our curated watchlists.