IFCI Price Action## Trend Overview
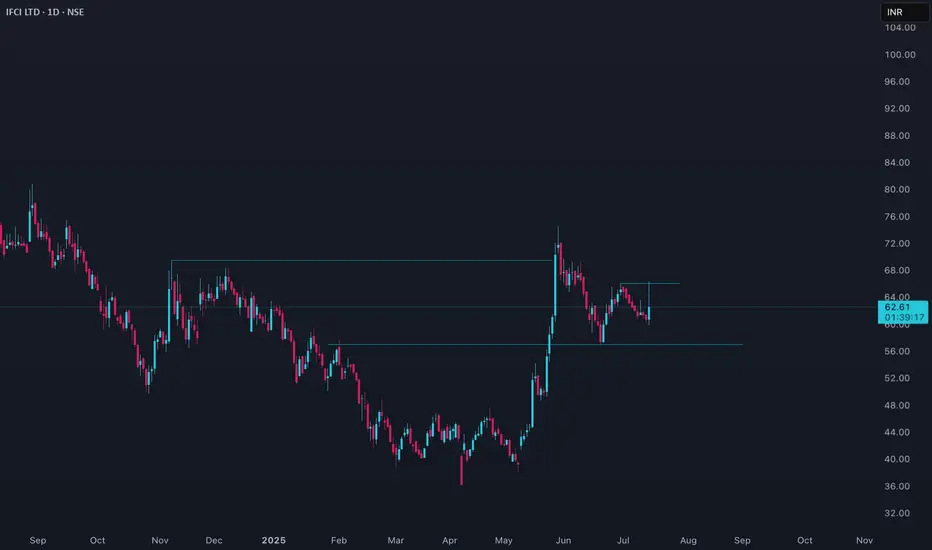
IFCI has shown significant volatility in recent months. After a strong rally earlier in the year, the stock has entered a corrective phase, with the price currently hovering around ₹60.58–₹64.50 as of July 14, 2025. The broader trend over the past year has been negative, but the l
1.41 INR
1.71 B INR
17.58 B INR
723.48 M
About IFCI Limited
Sector
Industry
CEO
Rahul Bhave
Website
Headquarters
New Delhi
Founded
1948
ISIN
INE039A01010
FIGI
BBG000D4HWM3
IFCI Ltd. operates as a non-banking finance company, which engages in the provision of financing activities that cover various projects. It operates through the following segments: Information About Products and Services, Information About Geographical Areas, and Information About Major Customers. The Information About Products and Services segment deals with only one product i.e. granted loans to corporate customers. The Information About Geographical Areas segment focuses on the entire sales that are made to customers which are domiciled in India. The Information About Major Customers segment doesn’t earn revenues from the customers which amount to 10 per cent or more revenues. It supports projects such as airports, roads, telecom, power, real estate, manufacturing, services sector and such other allied industries. The company was founded on July 1, 1948 and is headquartered in New Delhi, India.
Related stocks
RESEARCH REPORT: IFCI Ltd.Executive Summary
IFCI Ltd. recently staged a high-volume breakout on the weekly chart, triggering interest from technical traders. However, the core business remains fundamentally weak, with operating losses persisting. The balance sheet shows improvement, hinting at a slow turnaround, but lacks re

Good momentum stock, gave clean rally, pulled back and consolidaGood momentum stock, gave clean rally, pulled back and consolidated forming narrow ranges ready for B.O ( The output of the BO is based on mkt condition)

IFCI: Explosive Move Hits a Key WallTechnical Setup – IFCI Ltd. on the weekly timeframe chart
Current Price: ₹70.31
Breakout Confirmation: Price broke above major trendline resistance (dotted line) with strong volume
Volume Profile: Highest traded zone was around ₹42–₹50 (base built here)
Fibonacci Levels: 61.8% broken = bullis

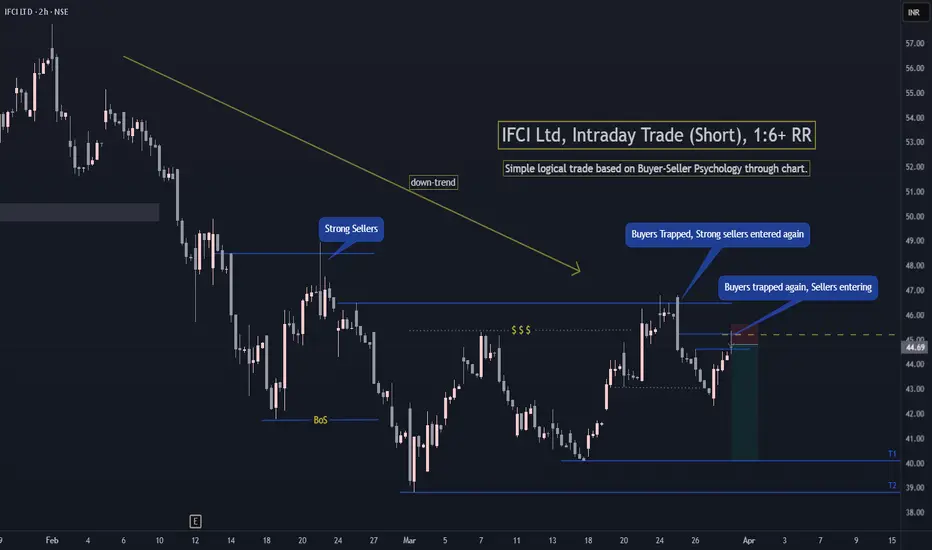
IFCI Intraday Trade (Short)IFCI is in down-trend and sellers have again trapped the buyers in discount zone. So there are high chances of price moving to Target 1 if Nifty is not very much bullish in coming sessions.
Simple trade based on buyer-seller psychology understanding. 1:6+ RR Trade.
If you have any questions. Do
IFCIINVERTED HEAD & SHOULDER PATTERN FORMATION
Neckline breakout point is @ 68.40 (roundoff 69)
Pattern target is @ 75.45
Disclaimer : This is my view & is my idea. And also it is only for educational purpose. Before buy / exit kindly contact your financial advisor


IFCI - Multiyear Breakout - MonthlyIFCI - Multiyear Breakout - Monthly
Multi-Year Breakout: The chart indicates a multi-year breakout with strong volume, suggesting a potential long-term uptrend.
16yrs high Breakout: Neckline marking a 16yrs breakout, which could be a shorter-term confirmation of the trend.
Support Level: The low of

IFCI buy this PSU gemYou can do you own analyzes and buy this stock, it is forming cup and handle pattern, i think it will go up soon once it forms complete handle. Good targets can be seen.

IFCI BO Ready LongDate : 28-07-2024
-------------------------------------
BO + ATH RESEARCH TO OBSERVE
IFCI Looks Good ABOVE 85
SL 45
Target 115, 145, 175, 266
Hold few Weeks to Months
Please consult your financial advisor before investing
All research for educational purposes only.

See all ideas
Summarizing what the indicators are suggesting.
Oscillators
Neutral
SellBuy
Strong sellStrong buy
Strong sellSellNeutralBuyStrong buy
Oscillators
Neutral
SellBuy
Strong sellStrong buy
Strong sellSellNeutralBuyStrong buy
Summary
Neutral
SellBuy
Strong sellStrong buy
Strong sellSellNeutralBuyStrong buy
Summary
Neutral
SellBuy
Strong sellStrong buy
Strong sellSellNeutralBuyStrong buy
Summary
Neutral
SellBuy
Strong sellStrong buy
Strong sellSellNeutralBuyStrong buy
Moving Averages
Neutral
SellBuy
Strong sellStrong buy
Strong sellSellNeutralBuyStrong buy
Moving Averages
Neutral
SellBuy
Strong sellStrong buy
Strong sellSellNeutralBuyStrong buy
Displays a symbol's price movements over previous years to identify recurring trends.
998IFCI30
IFCI Limited 9.98% 29-OCT-2030Yield to maturity
9.97%
Maturity date
Oct 29, 2030
975IFCI30
IFCI Limited 9.75% 13-JUL-2030Yield to maturity
9.73%
Maturity date
Jul 13, 2030
1070IFCI27
IFCI Limited 10.7% 28-FEB-2027Yield to maturity
9.55%
Maturity date
Feb 28, 2027
975IFCI28
IFCI Limited 9.75% 26-APR-2028Yield to maturity
8.75%
Maturity date
Apr 26, 2028
1075IFC26
IFCI Limited 10.75% 31-OCT-2026Yield to maturity
8.34%
Maturity date
Oct 31, 2026
1012IFCI27
IFCI Limited 10.12% 08-OCT-2027Yield to maturity
8.07%
Maturity date
Oct 8, 2027
97IFCI30
IFCI Limited 9.7% 04-MAY-2030Yield to maturity
7.85%
Maturity date
May 4, 2030
1075IFC26A
IFCI Limited 10.75% 01-AUG-2026Yield to maturity
5.98%
Maturity date
Aug 1, 2026
875IFCI26
IFCI Limited 8.75% 12-DEC-2026Yield to maturity
5.86%
Maturity date
Dec 12, 2026
872IFCI27D
IFCI Limited 8.72% 31-MAR-2027Yield to maturity
5.59%
Maturity date
Mar 31, 2027
916IFCI27A
IFCI Limited 9.16% 15-FEB-2027Yield to maturity
5.00%
Maturity date
Feb 15, 2027
See all IFCI bonds
MOSMALL250
Motilal Oswal Nifty Smallcap 250 ETF Units Exchange Traded FundWeight
0.18%
Market value
26.52 K
USD
MULTICAP
Mirae Asset Nifty500 Multicap 502525 ETF Exchange Traded Fund UnitsWeight
0.05%
Market value
2.67 K
USD
Explore more ETFs
Frequently Asked Questions
The current price of IFCI is 54.72 INR — it has increased by 0.09% in the past 24 hours. Watch IFCI Limited stock price performance more closely on the chart.
Depending on the exchange, the stock ticker may vary. For instance, on NSE exchange IFCI Limited stocks are traded under the ticker IFCI.
IFCI stock has risen by 1.52% compared to the previous week, the month change is a −0.78% fall, over the last year IFCI Limited has showed a −7.94% decrease.
IFCI reached its all-time high on Dec 17, 2007 with the price of 121.20 INR, and its all-time low was 2.45 INR and was reached on Jan 3, 2002. View more price dynamics on IFCI chart.
See other stocks reaching their highest and lowest prices.
See other stocks reaching their highest and lowest prices.
IFCI stock is 2.67% volatile and has beta coefficient of 2.64. Track IFCI Limited stock price on the chart and check out the list of the most volatile stocks — is IFCI Limited there?
Today IFCI Limited has the market capitalization of 147.46 B, it has increased by 1.93% over the last week.
Yes, you can track IFCI Limited financials in yearly and quarterly reports right on TradingView.
IFCI net income for the last quarter is 1.43 B INR, while the quarter before that showed 399.50 M INR of net income which accounts for 257.77% change. Track more IFCI Limited financial stats to get the full picture.
No, IFCI doesn't pay any dividends to its shareholders. But don't worry, we've prepared a list of high-dividend stocks for you.
As of Nov 16, 2025, the company has 140 employees. See our rating of the largest employees — is IFCI Limited on this list?
EBITDA measures a company's operating performance, its growth signifies an improvement in the efficiency of a company. IFCI Limited EBITDA is 7.06 B INR, and current EBITDA margin is 61.72%. See more stats in IFCI Limited financial statements.
Like other stocks, IFCI shares are traded on stock exchanges, e.g. Nasdaq, Nyse, Euronext, and the easiest way to buy them is through an online stock broker. To do this, you need to open an account and follow a broker's procedures, then start trading. You can trade IFCI Limited stock right from TradingView charts — choose your broker and connect to your account.
Investing in stocks requires a comprehensive research: you should carefully study all the available data, e.g. company's financials, related news, and its technical analysis. So IFCI Limited technincal analysis shows the sell today, and its 1 week rating is sell. Since market conditions are prone to changes, it's worth looking a bit further into the future — according to the 1 month rating IFCI Limited stock shows the buy signal. See more of IFCI Limited technicals for a more comprehensive analysis.
If you're still not sure, try looking for inspiration in our curated watchlists.
If you're still not sure, try looking for inspiration in our curated watchlists.