IndiaMArt - Reversal based on RSI CDIndiaMART (NSE) - Technical Analysis & Trade Setup
Current Price: 2,376.70
Trade Setup Overview
This trade setup is based on RSI Classic Divergence combined with Price Action analysis. The stock has shown a bullish divergence pattern on the RSI indicator while forming a potential bottom around the 2,243-2,377 zone.
Entry Strategy
Entry Type: Aggressive Entry (Current levels)
Confirmation Entry: Only initiate trades after candle closing above **2,437** on a 1:2 risk-reward ratio basis.
Target Levels
- Target 1: 2,459.70 (Fibonacci 0.382 level)
- Target 2: 2,593.00 (Fibonacci 0.618 level)
- Target 3: 2,676.65 (Fibonacci 1.0 extension)
**Potential Upside:** 8.5% to 12.6% from current levels
Risk Management
Stop Loss: 2,252.50 (on candle closing basis)
Risk from Current Price: ~5.2%
Technical Indicators
RSI Analysis
- RSI showing classic bullish divergence
- Price made lower lows while RSI made higher lows
- Current RSI around 62.25, indicating bullish momentum
- RSI breaking above previous resistance zones
Fibonacci Retracement Levels
- 0 (2,243.15) - Recent Low
- 0.382 (2,377.00) - Current Support Zone
- 0.618 (2,518.60) - Key Resistance
- 1.0 (2,676.25) - Extension Target
Key Observations
1. Stock has recovered from the October low of 2,243 levels
2. RSI divergence suggests potential trend reversal
3. Price action forming higher lows, indicating accumulation
4. Multiple Fibonacci resistance levels ahead that may act as profit-booking zones
Important Notes
- This is an **aggressive entry** setup for risk-tolerant traders
- Conservative traders should wait for confirmation above 2,437
- **Strictly maintain stop loss** on closing basis below 2,252.50
- Book partial profits at each target level
- Trail stop loss as price moves in your favor
- Monitor RSI for any bearish divergence at higher levels
Disclaimer
This analysis is for educational purposes only. Please do your own research or consult with a financial advisor before making any investment decisions. Past performance does not guarantee future results.
**Follow for more technical analysis and trade setups!**
#IndiaMART #TechnicalAnalysis #StockMarket #Trading #RSIDivergence #FibonacciTrading #NSE
Trade ideas

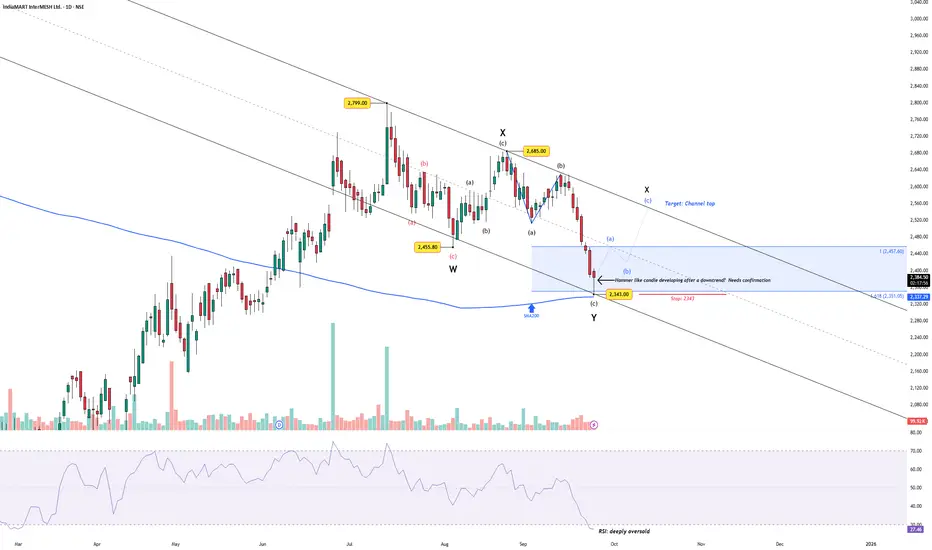
IndiaMART: Wave Y Hits 1.618 ExtensionAfter weeks of steady decline, IndiaMART has now landed at an interesting crossroad. The move from the recent swing high at ₹2,685 appears to have unfolded as a W–X–Y correction, with wave (c) of Y terminating almost precisely at the 1.618 extension of wave (a) from wave (b).
Technical highlights:
Channel support + 200-SMA: Price kissed the channel bottom right at the 200-day simple moving average.
Candlestick clue: A hammer-like candle is developing — but without confirmation it remains only a “maybe” reversal.
RSI deeply oversold: Momentum has stretched to extreme levels (27), suggesting downside exhaustion.
Volume: Still subdued, no classic capitulation spike yet.
Levels to watch:
Support / Stop: ₹2,343
First hurdle: ₹2,455
Bullish target (if reversal holds): Channel top
Takeaway
This setup ticks several boxes for a potential bounce: Fibonacci completion, structural support, oversold RSI, and reversal candle hints. But as always, the market demands proof. A convincing break above ₹2,455 would be the first sign of strength.
Disclaimer : This analysis is for educational purposes only and does not constitute investment advice. Please do your own research (DYOR) before making any trading decisions.
Risk Reward 1:5⦁ Only Trendlines Used — No Other Confluence
⦁ Stoploss Is Based on the Trendline
⦁ Retest of Trendline Builds Confidence
⦁ Trendline Angle Shows Momentum
⦁ Trendlines Define Risk Clearly
Indiamart Buy zoneEntry and stoploss are marked.
Risk reward = 1:2
If stoploss hits and you get a chance to re-enter the the trade then don't take risk more than 2 %.

INDIAMART looks Bullish..!!Risk/Reward ratio is good, and mentioned the same in chart.
Its a positional trade with min 1 yr to 2 years time frame.
** I AM NOT SEBI registered advisor please consult financial advisor for your investment.
**This is only for educational purpose you can also share your thoughts on the comments
Indiamart Again - Low Risk SetupCMP 2344 on 01.12.24
1. In recent sessions, the stock has formed a cup & handle pattern. But could not give a breakout of the formation.
2. At present, tested the lower level of HANDLE and formed a Double Bottom Pattern & gave a bounce back too.
3. If the momentum continues, may go into a bullish phase.
4. MACD is showing a reversal too.
5. The risk-reward ratio is quite good at the moment.
NOTE - The above illustration is my own view, shared here only for learning and observation purpose. it is not a bit of trading advice in any form.
All the best.

A stock that was supposed to move long backIndiamart Intermesh was supposed to be at pre-split levels of ₹10,000
Unfortunately, the momentum slowed
Now, the cup and handle and Fibo series indicate another upside coming

IndiaMart- Shining with Great Results -Best above 3228IndiaMART is India's largest online B2B marketplace, connecting buyers and suppliers across a wide range of products and services, primarily catering to small and medium enterprises (SMEs). Founded in 1999, the company has seen consistent growth, boasting a significant market share in the Indian online B2B classified space.
Key points about IndiaMART:
• Business Model:
A platform where buyers can search for suppliers based on their needs, with features like product listings, supplier profiles, and lead generation tools.
• Market Reach:
A large network of both buyers and sellers across various industries, including manufacturing, construction, electronics, and more.
• Growth Strategy:
Focus on expanding its user base by attracting smaller businesses and then upselling them to premium subscription plans, coupled with continuous technological upgrades to enhance user experience.
• Financial Performance:
IndiaMART has reported consistent revenue and profit growth over the years, attributed to its strong market position and increasing adoption of online B2B commerce in India.
• Investment Highlights:
• Deferred Revenue: A significant portion of IndiaMART's revenue comes from subscription fees paid upfront by sellers, creating a stable recurring revenue stream.
• High Return on Equity (ROE): The company historically generates high returns relative to its equity, indicating efficient use of capital.
• Minimal Debt: IndiaMART operates with minimal debt, further enhancing its financial stability.
Recent Developments:
• Continued focus on digital marketing and improving the platform's search capabilities to better match buyers with relevant suppliers.
• Expansion into newer sectors like services and international markets.
• Incorporation of advanced data analytics to provide insights and targeted recommendations to users
Chart Analysis :
The stock is making potential Cup & Handle Pattern. With solid returns the stock is expected to outperform.
One can enter above 3228 for target of 3725/4500 / 4800 with strict stop loss of 2840.
Targets may take few weeks to months and i suggest to average up as it moves up
Metric Q2 FY 2025
Revenue Growth - Revenue grew by 23% YoY, reaching ₹297 crore compared to ₹240.66 crore in Q2 FY2024
.
Operating Leverage - The company benefited from stable operational costs, helping maintain a strong operating margin
Margin Expansion - EBITDA margin improved, supported by cost control, with expectations of continued margin expansion
.
Debt Reduction- IndiaMart remains a debt-free company, focusing on cash flow management
.
Disclaimer : Educational Content. Please do your own research.
If you like this analysis, please do boost this post.

INDIAMART INTERMESH: 𝐏𝐨𝐭𝐞𝐧𝐭𝐢𝐚𝐥 𝐌𝐮𝐥𝐭𝐢𝐛𝐚𝐠𝐠𝐞𝐫#diwali pick (🤞🏼for this one)
🟢Highest ever op. cash & EPS
🟢Lowest ever public holding
🟢Lowest P/E in 5 years

INDIAMART -: 3200 ₹ TARGETINDIAMART -: 3200 ₹ TARGET
ACCUMULATED 2400₹ /2230 ₹
6 MONTH TIME FRAME
IndiaMART InterMESH Ltd. has an average target of 3387.80. The consensus estimate represents an upside of 35.05% from the last price of 2508.60. View 13 reports from 5 analysts offering long-term price targets for IndiaMART InterMESH Ltd..

INDIAMART - The most rewarding 3 of 3 in play now?INDIAMART CMP 3013
The price is all set to cross 4500+ in this impulse.. Looks like it is in the 3rd of 3rd wave from 1838..
1838 to 3335 = Wave 1
3335 to 2230 = Wave 2
and now wave 3 is unfolding from 2230 levels.. of which, we have done i and ii.. waiting for the break past 3335 for confirmation of the iiird..

Indiamart - Keep On WatchCMP - 2930 on 27.09.24
Since January 24, the stock has formed a Cup & Handle-like pattern. It is now retesting the immediate support, which is around 2900-2950. If picks a bullish momentum and gives breakout of C & H pattern. It may go to 3650/ 4100+.
However, the breakout level is above 3400 but the current price is a good place for an early entry with a more favorable risk-reward ratio.
Considering risk management, one has to choose the entry-level and position size wisely.
If the price sustains below 2620, This setup loses significance.
Trade wisely and calmly.
The above Illustration is only for educational and sharing purposes, not a trading recommendation in any form.
All the best.

indiamart target till 3200after very good correction its is really good option to invest in
indiamart futures or options till 3200

IndiaMART InterMESH Ltd (INDIAMART) - Technical Analysis UpdateCurrent Market Price (CMP): ₹3,059.90
Target: ₹5,500+
Entry Range: ₹2,800 – ₹3,000
Stop Loss: Below ₹2,650
Moving Averages:
21-Day EMA: ₹3,048.80
200-Day EMA: ₹3,016.70
Support Levels:
Immediate support at ₹2,830.81
Secondary support at ₹2,766.06
Strong support at ₹2,479.35
Technical Indicators:
EMA Setup: IndiaMART is holding well above both its 21-day and 200-day EMAs, which indicates short-to-mid-term bullish momentum
My View: IndiaMART is a solid bet in the current market with a well-defined risk-reward setup. As the stock is consolidating near key support levels, I expect a breakout toward ₹8,500+ levels in the medium to long term.

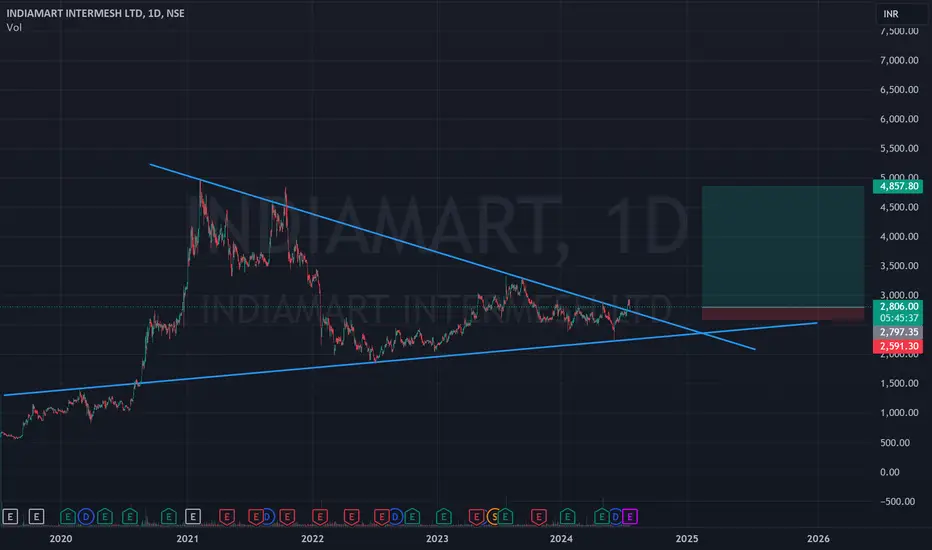
INDIAMART - Weekly AnalysisIn the Weekly Chart of INDIAMART,
we can see that, it has respected the Trendline.
Soon it will take a momentum in some direction.
Expected momentums are shown in chart.

Cup and Handle Target 5700Chart formed a Cup and Handle formation giving target of 5700 though volume support is low but price action is moving in a right direction.

Indiamart looks good for a swing Hello traders,
Indiamart, looks good for a swing levels are marked on the chart. consider stoploss on monthly closing basis

INDIAMART - Ripening for a Mark UpLet's evaluate the stock:
The Stock has been accumulating for the past 2 years and is Range Bound.
The Stock has tried to break The Resistance but unable to do so. The first time it tried to break was in Jul'23 but failed.
Reason being good results of Jun'23 Quarter which did not sustain and the stock came back down again to its Support levels.
Now, Dec'23 results were almost as good as Jun'23, compounded with better results for Mar'24 and Jun'24(which is best quarterly result in the past 3 years).
If the quarterly result for Sep'24 came as expected the stock can rally and hit short term targets of T1 and T2(based on Fib Extension). Long Term target is ATH.
The Institutions are slowly building their positions in the stock.
The fundamentals are Strong, with healthy DE and PEG Ratio, the stock is currently undervalued. Sales growth is also very Solid.
I will definitely keep this stock in my watchlist for the next month and keep a close eye on the technical before Sep'24 results are out.
*Not an investment Advice, only for educational purposes*

Indiamart cup with handle patternGood results, good pattern
You know it will get there
Target - 4531

Indiamart intermesh cup with handleAfter good results this stock fell to form this pattern and buyers came in earlier and has formed a beautiful cup with handle pattern with a superb target of 4531. It will get there, soon.

Go Long on IndiamartThe stock shows signs of bearish sentiment in the short term, challenging support levels that could decide the near-term direction. The company recognizes issues like customer churn and is actively deploying solutions to improve retention and stabilize its customer base.

Indiamart - Bullish Divergence - Symmetrical Triangle BreakoutIndiaMART InterMESH Ltd. has shown a strong bullish divergence, breaking out from a symmetrical triangle pattern and currently testing a crucial retest level. This setup presents a potentially favorable opportunity, if the support at the trendline holds next week.
Technical Analysis:
Symmetrical Triangle Pattern: The stock has been consolidating within a symmetrical triangle, characterized by converging trendlines of higher lows and lower highs.
Bullish Divergence: The price made a lower low while the RSI made a higher low, indicating a bullish divergence and suggesting weakening selling pressure.
Breakout Confirmation: The price recently broke above the upper boundary of the triangle, confirming a bullish breakout.
Retest Level: The price is currently retesting the breakout level around ₹2,780. If it reverses upwards from this trendline, the setup looks promising.
Disclaimer: This analysis is for informational purposes only and should not be considered financial advice.

INDIA MART TARGET 3234 STOP LOSS 2831Script is long term symmetrical triangle breakout with day bullish closing. short term target is 3234. long term target is 3821
