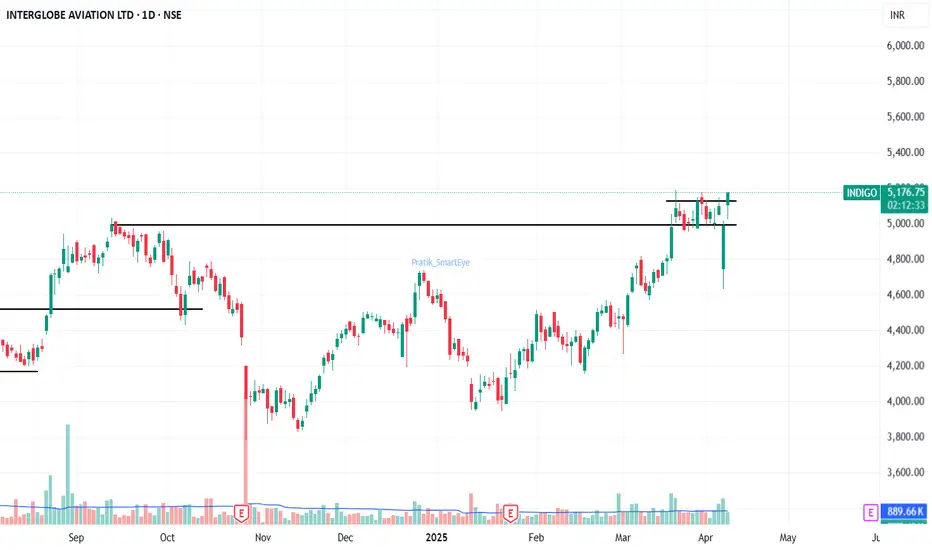
Indigo - Breakout of flag pattern. CMP 5150.Indigo - Breakout of flag pattern. CMP 5150.
After a rounding bottom breakout the stock traded in a small zone and breaking above the zone today. sustained close above the flag line can give a good up-move.
SL 5000 closing basis.
INTERGLOBE AVIATION LTD
5,773.50INRR
+11.50+0.20%
As of today at 04:34 GMT
INR
No trades
INDIGO trade ideas
INDIGO PRZ at 5800Indigo PRZ is around 5800 levels. Expecting a good pullback (below 5K) once it reaches the PRZ. Not a place to go long at this price.. Waiting for the pattern to mature and reversal signs along with confirmation to initiate the trade..
Trading is 80% waiting :)
Disclaimer: I am not a SEBI registered Analyst and this is not a trading advise. Views are personal and for educational purpose only. Please consult your Financial Advisor for any investment decisions. Please consider my views only to get a different perspective (FOR or AGAINST your views). Please don't trade FNO based on my views. If you like my analysis and learnt something from it, please give a BOOST. Feel free to express your thoughts and questions in the comments section.

INDIGO-Technical & Elliott Wave Breakdown📊 Technical & Elliott Wave Breakdown
✅ Wave Count:
The wave count appears complete or nearing completion:
• Wave (1): ₹1,666 → ₹2,748
• Wave (2): ₹2,748→ ₹2,333 (corrective)
• Wave (3): ₹2,333 → ₹5,032 (extended impulse)
• Wave (4): ₹5,032 → ₹3,780 → ₹3,945 (complex ABC correction)
• Wave (5): Now at ₹5,816 (current weekly high), already moved ~₹1,875 from Wave 4 bottom
• 📈 Wave 5 has now approached the upper boundary of a long-term rising trend channel.
🔍 Price & Volume Insights
• Recent breakout candles (last 2–3 weeks) show strong bullish momentum with high volumes (137M+)
• Weekly close near the high, signalling institutional interest
• Price respects both the parallel channel and Fibonacci zones
📈 Target Projections for Wave 5 (Measured Moves):
Wave 5 started from ~₹3,945:
Projection Method
• Wave 5 = Wave 1 (~₹934) ₹4,880 ✅ Passed
• Wave 5 = 0.618 × Wave 3 (~₹2,276) ₹5,360–5,400 ✅ Reached
• Current price ₹5,816 🔼 Ongoing
• Wave 5 = Wave 3 (~₹2,276) ₹6,200–6,250 🔜 Possible
• Wave 5 = 1.618 × Wave 1 (~₹1,500) ₹5,445 ✅ Surpassed
• Upper trendline resistance ₹6,400–6,500 🔴 Strong zone
🔁 Fibonacci Channel & Trendlines
• Upper trendline of the rising channel is currently at ₹6,500–6,650
• Historically, Wave 5 often ends near channel tops—this range can act as a terminal zone unless a blow-off top occurs
🧭 Way Forward: Two Probable Scenarios
✅ Scenario 1: Bullish Continuation
• Price may extend toward ₹6,200–6,500, completing full 5-wave structure
• If breakout occurs above ₹6,500 with volume and momentum, ₹7,000–7,400 is the next Fibonacci-projected stretch
⚠️ Scenario 2: Impulse Top and Correction
• If rejection occurs near ₹6,400–6,500, a corrective ABC may unfold
• Initial pullback zone:
o 0.382 retracement of Wave 3–5: ₹5,000–5,200
o Strong support: ₹4,740 (previous Wave B high)
🛠️ Action Plan
If Holding Long:
• Trail SL to ₹5,400–5,500
• Book partial profits near ₹6,200–6,400
For New Entry:
• Avoid fresh longs now
• Wait for pullback to ₹5,000–5,200 or a high-volume breakout above ₹6,500
📌 Thanks a ton for checking out my idea! Hope it sparked some value for you.
🙏 Follow for more insights
👍 Boost if you found it helpful
✍️ Drop a comment with your thoughts below!


INDIGO As we Observe on INDIGO Daily time frame, one can notice a clear RSI Divergence along with Price rejection area (Supply Zone) as it was retested once and became a valid Resistance zone and we may see some correction in coming days with a Stoploss of Recent Swing high + 0.25% on Price closing basis with a Target of 1:3. even we can see a Big gap below. Just a View Not a Reco...

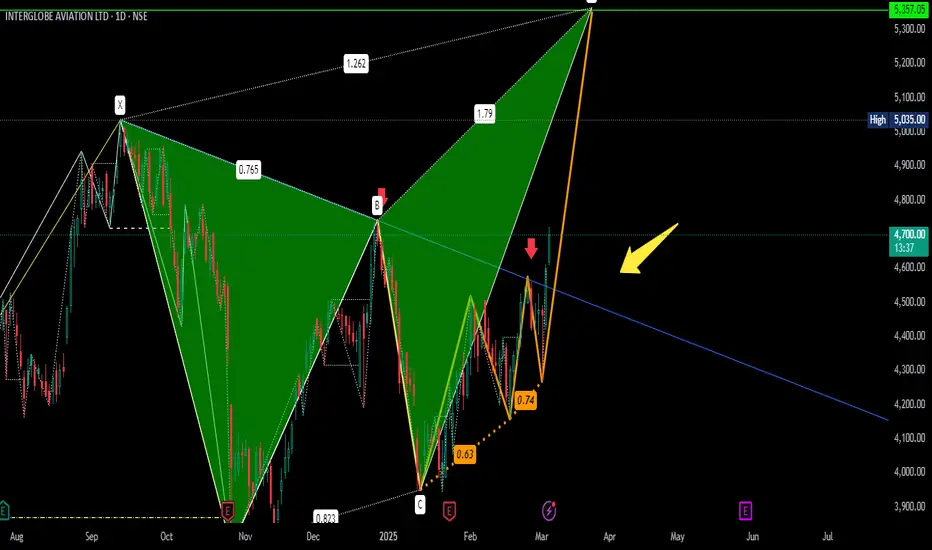
INTERGLOBE AVIATION – Elliot & Harmonic Pattern TargetsElliot Wave reading-
Indigo, has been range bound for last 6 months from a level of 5038, where wave-3 was completed, and then corrective wave -4 completed at 3960 levels.
Wave-1 completed at 2745.10
Wave-2 Completed at 2333.35
Motive wave-5 is in formation, Probable Targets of wave-5 as per Elliot wave are:
• 0.618 extension of wave -1 @ 4626 (which has already breached)
• Wave-5 may travel same distance as wave-1 @ 5038
Harmonic Pattern Reading:
Butterfly wave pattern (XABCD)was in formation, The 0.786 (actual 0.764) retracement of the XA leg is the most important ratio and gives the confirmation of Pattern. Which gives us point B at 4739 level.
The Multiple Potential Possible PRZ ( Point D) are
• 1.618 Retracement of BC at 5232.5
• 2.618 Retracement of BC at 6026.33
Strategy for Agressive Traders
Option-1: Entry @ Confirm Breakout: Closing above 4800;
Stop Loss: Closing below 4730
Target -1: 5035 (As per Elliot); Book 25% profit
Target-2: 5235.5 (as per harmonic pattern) book profit
Aggressive traders can carry forward 25% of position, with trailing stop loss (low of previous day) for a target of 6026.33
Option- 2:
• Entry at 4371-4400
• Stop Loss: 4167
• Target-1: 4739
• Target-2: 5035
✅For More Trading Ideas, LIKE SHARE & FOLLOW My Idea Stream✅

Momentum Stocks to Watch: INDIGO & NH Gear Up for Rally◉ Interglobe Aviation NSE:INDIGO
● The stock has formed a Symmetrical Triangle pattern on the daily chart.
● Following a recent breakout, the price is anticipated to witness substantial upward movement in the coming days.
◉ Narayana Hrudalaya NSE:NH
● After a prolonged consolidation phase, the stock has developed a Rounding Bottom pattern.
● With the price breaking out of this pattern, it is now trending upward, signalling potential for further gains in the near term.

IndiGo Stock: Symmetric Triangle Breakout & Growth ProspectsTechnical Analysis:
IndiGo stock has been in an uninterrupted uptrend since ₹900, reaching ₹5,000 over time. The stock had been in a range-bound situation since early 2024, forming a symmetric triangle pattern marked by higher lows and lower highs.
On January 24, the company released its Q3 FY25 financial results, and the stock began to demonstrate gradual price appreciation, with a higher lows pattern. Yesterday, the breakout in the symmetric triangle was confirmed, indicating bullish strength.
For volume confirmation, on February 28, the stock had 2.13 million in volume, which was the highest bullish volume in six months (since September 2024). With this breakout, the next resistance levels to watch are:
₹4,725 – First target
₹5,035 – All-time high target
On the risk management front, stop-loss levels are important:
₹4,421 – First stop-loss (candle low)
₹4,325 – Potential higher low support
Despite the stock being bullish, these levels need to be kept in mind to effectively manage risk.
Fundamental Analysis:
IndiGo announced robust Q3 FY25 financial performance, supporting its growth story. Following are the key financial highlights (values in ₹ crore):
Total Income: ₹22,111 in Q3 FY25 (up from ₹19,452 in Q3 FY24 and ₹14,944 in Q2 FY25)
Total Expenses: ₹17,701 in Q3 FY25 (up from ₹15,918 in Q3 FY24 and ₹13,675 in Q2 FY25 on account of expansion of operations)
Profit Before Tax: ₹4,410 in Q3 FY25 (up from ₹3,534 in Q3 FY24 and considerably higher than ₹1,269 in Q2 FY25, reflecting robust sequential growth)
Profit After Tax: ₹2,449 during Q3 FY25 (versus ₹2,998 during Q3 FY24 but markedly better than ₹189 during Q2 FY25)
IndiGo's topline and bottom line have had a good sequential and year-on-year growth, affirming firm demand and efficient cost control.
Conclusion:
With a bullish breakout, strong financial performance, and high trading volumes, IndiGo stock is promising for long-term gains. If the stock can hold up over key resistance levels, it can go on to its all-time high. Traders, however, need to keep an eye on stop-loss levels to control risks effectively.
Disclaimer: This study is for educational purposes only. Investors are advised to do their own research before making any trading decisions.


PERFECT 3 DRIVE PATTERNIf you see this stock INTERGLOB AVIATIONLTD.You will find that it is reacting almost at same price diferrence among it's previous high so i am bearish in this stock its my view as per pattern sugesting if you buy/sell that will be your own decision.Remember it's not my buy/sell call.

interlobe aviation ltdLet's conduct a **technical analysis** of **InterGlobe Aviation Ltd.** (IndiGo), which is the parent company of IndiGo Airlines. Here's a detailed breakdown of how you can analyze the stock using key technical indicators.
---
### **Technical Analysis of InterGlobe Aviation Ltd. (IndiGo)**
#### **1. Support and Resistance Levels**
- **Support Levels:**
- Support is where the stock has previously bounced back from, indicating a level where buying interest has emerged.
- **Example Support Levels:** If InterGlobe Aviation has recently found support near ₹2,050, ₹2,100, or ₹2,150, these levels are important to watch.
- A drop below these levels could indicate a potential bearish move or a deeper correction.
- **Resistance Levels:**
- Resistance is where selling pressure has previously emerged, preventing the stock from moving higher.
- **Example Resistance Levels:** Levels like ₹2,250, ₹2,300, or ₹2,350 could be areas of resistance for the stock.
- A breakout above these levels could indicate further bullish momentum and a potential continuation of the uptrend.
#### **2. Moving Averages (MA)**
- **50-day Moving Average (MA):**
- The 50-day MA helps identify the short-term trend. If the stock is trading above this moving average, it suggests bullish momentum.
- **Example:** If InterGlobe is trading at ₹2,150 and the 50-day MA is ₹2,100, it signals short-term bullish momentum.
- **200-day Moving Average (MA):**
- The 200-day MA is used to gauge long-term trends. If the stock is above this MA, it suggests a long-term bullish trend.
- **Example:** If the stock is at ₹2,150 and the 200-day MA is ₹2,100, it indicates that the long-term trend is positive.
#### **3. RSI (Relative Strength Index)**
- **RSI Levels:**
- **Above 70:** The stock may be overbought, indicating a potential pullback or consolidation.
- **Below 30:** The stock may be oversold, suggesting a potential buying opportunity for a reversal.
- **Current Example:**
- If the RSI is **above 70**, it suggests that InterGlobe might be overbought, signaling a possible price correction.
- If the RSI is **below 30**, it indicates the stock might be oversold, potentially signaling a buying opportunity for a rebound.
#### **4. MACD (Moving Average Convergence Divergence)**
- **Bullish Signal:** A bullish crossover occurs when the MACD line crosses above the signal line, suggesting an upward price movement.
- **Bearish Signal:** A bearish crossover occurs when the MACD line crosses below the signal line, signaling a potential downward move.
- **Current Example:**
- If the MACD line is above the signal line, this is a bullish signal for InterGlobe Aviation, suggesting the potential for upward movement.
- If the MACD line is below the signal line, it may indicate a bearish trend or consolidation.
#### **5. Volume Analysis**
- **Increasing Volume:** Rising prices accompanied by increasing volume typically signal strong buying interest and confirmation of the trend.
- **Decreasing Volume:** If the price moves up or down with decreasing volume, it suggests that the move lacks conviction.
- **Current Example:**
- If InterGlobe is rising with increasing volume, it supports the bullish trend.
- If the stock rises or falls with declining volume, it might suggest that the trend is weakening or about to reverse.
#### **6. Candlestick Patterns**
- **Bullish Patterns:**
- Patterns like **Bullish Engulfing**, **Morning Star**, or **Hammer** near support levels could indicate potential price reversals to the upside.
- **Bearish Patterns:**
- Patterns like **Shooting Star**, **Bearish Engulfing**, or **Evening Star** near resistance levels could suggest a potential reversal to the downside.
- **Current Example:**
- A **Bullish Engulfing** pattern at ₹2,100 (support) could signal a potential upward move.
- A **Shooting Star** pattern near ₹2,250 (resistance) might indicate a possible reversal downward.
#### **7. Fibonacci Retracement Levels**
- **Fibonacci Retracement Levels** are used to identify potential support and resistance levels during a pullback. Key levels include **23.6%, 38.2%, 50%, 61.8%**.
- **Current Example:**
- If InterGlobe has moved from ₹2,000 to ₹2,300, key Fibonacci retracement levels would be:
- **23.6% retracement** around ₹2,250
- **38.2% retracement** around ₹2,200
- **50% retracement** around ₹2,150
- **61.8% retracement** around ₹2,100
These levels can act as support if the stock pulls back, or as resistance if the stock faces a correction within an uptrend.
---
**Disclaimer:**
- I am not a SEBI-registered professional or licensed financial advisor.
- The analysis and recommendations provided here are based on historical price data, technical indicators, and market trends.
- Any decisions you make based on this information are entirely at your own risk. Please consult with a licensed financial advisor before making any investment decisions.
- Technical analysis is not a guarantee of future performance, and stock prices can be affected by various factors including news, economic data, and other market influences.

INDIGO to DUMP on Earnings!Attached: Daily Live Chart 24th Jan 2025
- Price below POC Volume Profile, 20 DSMA & Chandelier Stop
- Sideways consolidation waiting to DUMP
- Larger Bear Flag + Super Bearish HNS🐻🔨📉
- Price also below Ichimoku Cloud
Sub 4000 to 3750, to 3500 downside target🎯
Downside can stretch all the way to 3200 to 3000🎯 as well as Price would trade below the 200 Day EMA and the Worst Price Declines happen below the 200 day moving average!
And another Bearish Fundamental note is:
In last 6 months, promoter holding in the company has decreased by 6.02% and they are the largest holders of the stock while DIIs (Mutual Fund) holding has been continuously increasing meaning mean Smart Money dumping/ Change of Hands

Rally back to the highs on cardsInterglobe CMP 4090
Elliott- the C leg rally of B should finish either at 4686 or back to the highs.
Fibs- the stock is at fib support as well as at trendline crossover zone.
RSI - At price support RSI is taking support above its bull zone.
Conclusion - to me a rally from here is very very likely. I will say exit round 4686.

INTERGLOBE AVIATION-UP FOR SWING TRADEInterGlobe Aviation: CMP:4469; RSI: 69.62
As per Elliot wave analysis, Inter Globe Aviation has completed primary wave-4 formation @ 3780 and motive wave-5 is in its initial phase of expansion. Confirmation of the same will be evident when script give close above 4885 levels on closing basis. A swing trade is poised in the near future with a upside of 15-20%.
Call For Aggressive traders
Buy Zone: 4400-4500
Stop Loss: 4300
Resistance Zone: 4772-4885
Target 1: 5125; Target 2: 5400
Call For long term Investor
Buy above: 4900
Target: 6400 (1 year time frame)
Stop Loss: 4300

Indigo - A low risk short set upRationale:
Primary 3rd wave seem to have ended at 5035 (charts with counts are attached); and from there on, I could see 3 wave down from the top and a three wave rise from the bottom. Hence, the move appears to be corrective.
Price is getting rejected at the supply zone of 4700-4800. And I consider this a X or B terminating the upmove.
If the seller at 4700 is to take over, then he can easily push it down again to 3700 levels or lower)
I expect this final leg of correction to hit 3300-3500 levels. break of 4190 would give additional confirmation
View becomes invalid if the price goes above 4700. Low risk trades can keep 4650 as SL
Daily Chart with counts:
on very very short term, price has completed 5 wave impulse, and a pullback towards 4630 cant be ruled out
I am not a SEBI registered Analyst. Views are personal and for educational purpose only. Please consult your Financial Advisor for any investment decisions. Please consider my views only to get a different perspective (FOR or AGAINST your views). Please don't trade FNO based on my views.

No more ruling the skies of the aviation sector!! - INDIGOInterglobal Aviation (INDIGO) has shown several bearish patterns recently, indicating potential downward trends in its stock performance.
Weekly : Bearish Engulfing Candlestick Pattern.
Daily : Three Outside Down with very weak volume
Each candlestick pattern confirms a bearish trend, suggesting a short trade. Additionally, global factors are expected to impact the aviation sector.
Entry: 4425
Stop Loss: 4740
Target: Open/Mentioned.
Let me know if you found this interesting.
Happy trading! 😄


3 Amazing swing trading idea for 26 December MarketsI daily make educational content videos for swing / positional trading
Gulf oil trade idea: This idea is about a breakout trade that went sideways at the breakout point and is currently in a no-trading zone, pink zones tell you about what to do next
Axiscades trade idea: This idea is about the weekly time frame breakout, its at a strong resistance area of a hidden parallel channel, needs a strong closing for the same
Indigo trade idea: This idea is also a breakout idea on Daily time frame but needs to follow a set of market structure from here on and price action to give a nice trade activation

INVERTED HEAD & SOULDER PATTERN Here INTERGLOBE AVIATION giving us to chance to buy keep it in mind there is clear breakout and closed above neckline.In this chart i mentioned here one support and 2 resistances as target T1 & T2 one more resistance is here at cross line of blue coloured lines below which stock get closed. This is not my buy/sell advice note it please,

INDIGO - Ready to Fly AgainDate : 24-Dec-2024
LTP : Rs. 4,612.25
Targets: (T1) Rs. 4,788 --> (T2) Rs. 5,035 --> (T3) Rs. 5,780
SL : Rs. 4,193
Technical View:
• NSE:INDIGO is in strong primary uptrend and was recently going through secondary downtrend within primary uptrend.
• After touching a high of 5,035 on 12-Sep-2024, NSE:INDIGO has retraced 24% to 3,830 level.
• NSE:INDIGO has given breakout from it's secondary downtrend with higher than average volume on 24-Dec-2024.
• NSE:INDIGO is trading above 20 DEMA and 50 DEMA since last few sessions. 20 DEMA has also crossed over 50 DEMA.
• RSI is trading at 69.15 and MACD is trading at 58.13.
• Ready to fly again. Fasten your seat belt.
Liked the analysis? Boost/Like this idea and follow my ID for more ideas.
Disclaimer: I am not a SEBI registered analyst/consultant and not recommending anyone to take any BUY or SELL position in stock market. Investing in stock market is risky and one should do a self analysis and validation before investing in stock market. My ideas are published for learning purpose only and are available to everyone at no cost/charge.

INDIGO - Fall PossibleAfter good uptrend past few weeks, stock may be reaching an exhaustion point
4520 - 4580 excellent resistance area
If stock takes a pause here, there is a high possibility of bears taking over again
If happens so, it will be easy for the stock to reach its 1st potential target of 4160
Any close above 4600 will negate the view
