INDIGO PAINTS 1MIndigo paints is forming a inverse head and shoulder on a monthly timframe. Company have a very good fundamentals and a good PE ratio as compared to the Industry PE ratio. the stock price a=can shoot up once it break the marked resistance. You can take trade according to your own analysis.
Trade ideas

Waiting for Breakout of weekly chartIndigo Paints waiting for Big Breakout on the weekly chart.
Buy Above 1615, SL - 1491
NOTE:- Please maintain good Risk to Reward, as per your Risk appetite.

Indigo Paints Ltd,Indigo Paints Ltd , Small cap Share,..........(be cautious ,trade as per your risk)
On Jun 23rd Golden crossover happened.
Good one for short term and long term............

buybuy at cmp 1037 SL 1000 tarrget 5 times of risk.
Disc : It's not an investment advise to buy or sell

Trading in Narrow range on Daily chart Indigo Paints trading in a narrow range, with very high chances of a breakout.
Buy above 1460, SL 1410.
NOTE: Please maintain good Risk to Reward, as per your appetite.

Indigo Paints Weekly Flag BOA bu;lish Flag and Pole Pattern has been observed on daily charts in NSE:INDIGOPNTS one can look into it to create a fresh position in the scrip at cmp of 1500 or below with stop loss of 1420 and for targets of rs 1575/1650/1725/1800/1875
Exit the position if the stop loss is triggered on WCB.
DO YOU WANT ALL MY RESEARCH FOR FREE THEN DON'T FORGET TO FOLLOW ME.
I AM EAGERLY WAITING FOR YOUR COMMENTS ON THE STUDY...
Disclaimer: Content shared is for information and education purposes only and should not be treated as investment or trading advice. Please do your own analysis or take independent professional financial advice before making any investments based on your own personal circumstances. Investment in securities are subject to market risks, please carry out your due diligence before investing. And last but not the least, past performance is not indicative of future returns.

INDIGO points Breakout and Retest in 1Day timeframeIndigopaints ready to make new high.
Strong breakout + retested from trend line

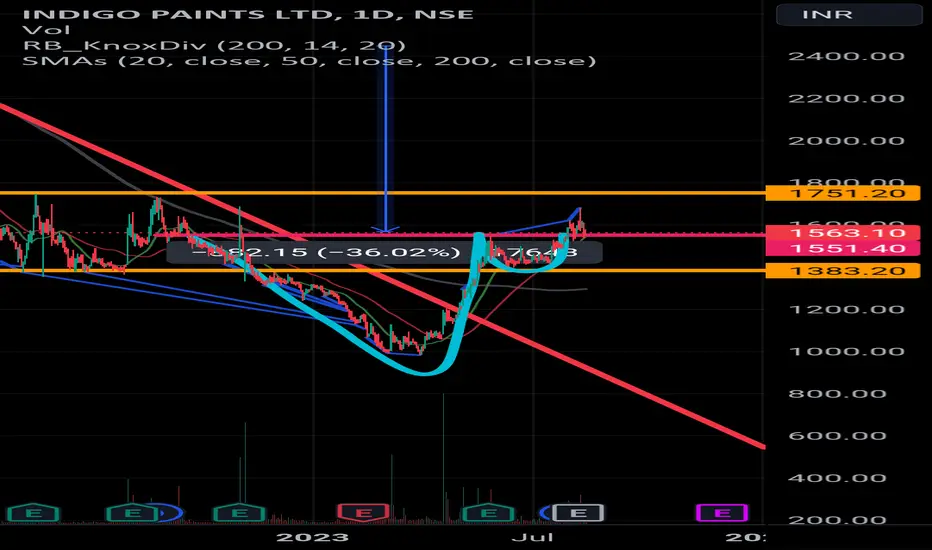
Breakout of Cup and Handle pattern for Indigo Paints LtdCup and Handle pattern formation can be seen on a weekly basis for Indigo Paints Ltd with a golden cross over pattern
CMP 1575 Target 1735

Indigo Paints Daily Breakout chart Indigo Paints Daily Breakout chart , Please do your own analysis , its educational purpose only , analysis details in video

Paints are looking for a leg up!Hi
Just waiting for this major resistance breakout. Can be today or tomorrow.
If done right, with volume we can easily go to the next level

Indigo can paint your portfolio green!Indigo paints had a bumper listing during its IPO with 100% premium over issue price.
However, since its listing, it has been in a downtrend and has corrected to an attractive valuation.
The stock has already broken the downtrend and is now looking strong for a new upmove.
The targets and SL are given in the chart. One can enter at CMP if his/her outlook is of a longer horizon.
Please note that idea is shared just for educational purposes!

VIEW ON INDIGO PAINT@Indigo paint is Good growth company in paint sector.
you can bet on the company for long term.
#Rounding Bottom

Indigo paint to take longLong indigo paint. Stock trading above 50 EMA on every move. RSI also forms positive divergences. All levels have been marked on the charts. This is for your educational purpose only.

INDIGOPNTS - Weekly AnalysisIn the Weekly Chart of INDIGOPNTS ,
we can see that; it might form a Inverted Head & Shoulder.
Expected momentum is shown in chart.

INDIGOPNTS higher lows higher highsIndigo Paints making higher lows and higher highs. Plus has huge volume spikes at/near bottom, indicating bottoming out.
Entry: Now.
S/L: -5%

indigo paintsfirst sign of reversal
a morning star in monthly
A 'w' pattern with break of neckline in weekly
have a close watch and go long if the uptrend continues
965 could be a good SL

INDIGOPNTS target 1700Indigo paints
Entry above 1380
Target Above 1700
stop loss below 1250
note : for educational purpose only , not sebi registered , published on december 21

Good Volume in Lower Side Some Bounce Back ExceptedAs we can see that indigo paints has corrected very much and now we can see the strong bullish momentum from 1400 level which is good support 1300 and tg 1400 and 1450-1500.

bearish on indigo paintsFurther continuing downtrend, The technicals of indigo paints seem weak. A down move of approximately 9.5% is expected. It recently formed head and shoulder pattern and also Fibonacci retracement levels concurs with the former statement that it is expected to fall (roughly to around Rs 1350). 1350 being a important support lets se how the stock reacts there if it breaks it, a further fall is expected.
What do you think about this? Please let me know in the comments.

Indigopaints analysis as we can see that indigo paints has corrected very much and now we can see the strong bullish momentum from 1400 level which is good support
aslo it has breaked the 50 ma and now taking support on 100 ma which is also a good sign to go up for the stock
and we see that RSI is also bullish breaked 60 level with strong bullish candle (BUllISH DIVERGENCE CAN BE SEEN ) which is also a good confirmation
1st target 1697
2nd target 1761
(do your own analysis while entering the trade)

INDIGO PAINTS breakout trendlineYour consider as investment purpose right now this is very good pick. currently stock was corrected 55 % which is to much . Indigo Paints is largest paint company before asian paints.

Indigo PaintsYour Money Your Decision..
In Long Run, Intraday trading doesn't work..
Join LEARNINGSTOCKMARKET
