IndusindBank Trade (30/06/23) Market is Bullish Trends So select bullish stock. And applied Cpr With Camarilla Strategy... Break Resistance zone So Price will go next resistance...
INDUSINDBK trade ideas

INDUSIND BANK LOOKS GOODIndusind Bank looks good after breaking a falling resistance trendline on weekly chart and gives a close above so we can consider it is breakout of triangle resistance trendline and after a breakout of falling resistance trendline we can go long in it for the target of 1369 taking stop loss of 1200 below a weekly candle close.
NOTE- Only for Education Purpose.
Please Give A Like If You Like

INDUSIND BANK :- BREAKOUT ON MONTHLY CHARTThe stock has given breakout on monthly chart and can test 1500+ in the short term.
The stop-loss should be placed at 1250.

INDUSIND BANKENTRY TARGET SL Mention in the chart.
ALWAYS TAKE TRADE WITH CONFIRMATION
Note : Trading in any financial market is very risky. I post ideas for educational purpose only. It is not financial advice. Do not hold us responsible for any potential loss you may incur. Please consult your financial adviser before trading.

INDUSIND BANK may test 1250INDUSIND BANK may test 1250
It broken major support on Daily and Hourly chart

Indusind Bank crossing weekly resistance zone.IndusInd Bank trading just above support zone. Next resistance zone is around 1600.


INDUSINDBK - Cup n Handle pattern breakout- 27% upside potentialINDUSINDBK has given Cup n Handle pattern from 1240 resistance levels.
It has given good weekly closing above these levels.
Target is coming to 1480 and then 1680 levels.
SL: Daily candle close below 1240.

INDUSIND- 1900 POSSIBLEIndusind Bank has broken out of a triangle pattern on monthly time frame. Looks to go around 1900-2000 levels in coming 8-12 months. Ideal buy zone is between 1165-1250 range for possible upmove.

#Nifty IndusInd Bank. Continues next leg of uptrendIndusInd bank after breaking out of long consolidation is looking to go for next leg of up move with strong bullish engulfing candle

INDUSIND BANK TARGET 1584INDUSAND BANK raising wedge breakout with weekly bullish closing confirmation. If it sustains above 1346 in day chart it will reach 1584

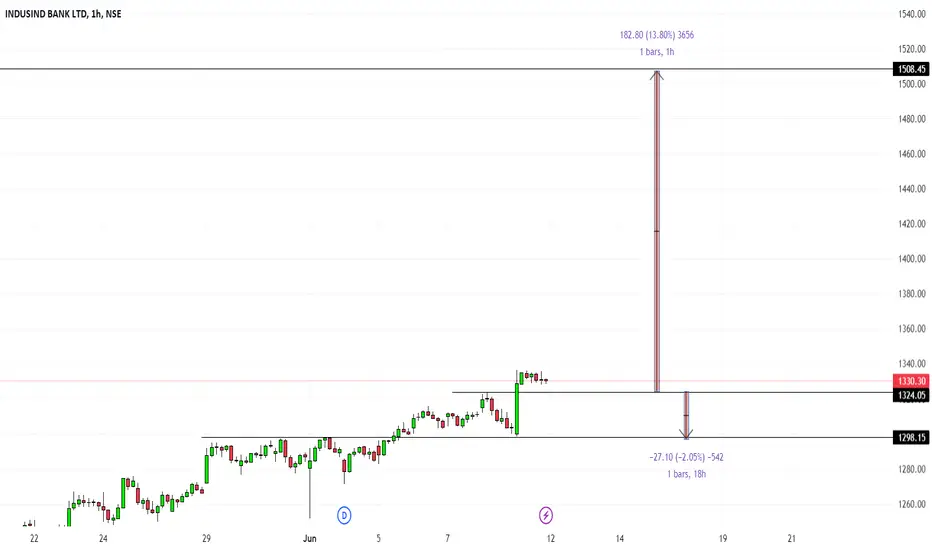
Long entry is possible after retestGiven a huge breakout and wait for perfect retest at 1325 and SL can be 1295
Profit can go up to 1500
INDUSINDBNK SWING TRADE IDEAIndusInd bank just entered good quality daily sz
Entry, Stoploss and target are marked on the chart.

INDUSIND BANKAm I Seeing it correctly ? It is showing good breakout in monthly chart and closing is also there. Keep in watch list


IndusInd Bank: Cup and Handle Breakout ConfirmationThe script has shown a Cup and handle Breakout with good volumes.
Keeping in the mind that all the private sector banks have almost reached to their ATH this script is lagging behind a little bit which gives a good scope of gains.
Best Entry: 1180-1200 Levels
Sl: below TL on Daily Closing basis
Target: as per yellow line levels
DISC: I am not a SEBI registered research analyst, Please consult your financial advisor before making any buy or sell.

INDUSINDBANK STANDING ON RESISTANCEIndusind bank is standing on long term resistance
need to watch if it is going to break it
volume is good,stock to watch
educational idea

INDUSINDBKINDUSUNDBK trading in crucial range it reversed multiple times from this resistance line it can go either side.

Trading at Crucial level. Breakout or breakdown happens 1. Stock trading at very crucial resistance level ( 1275 )
2. From 2020 FEB this stock not crossed that level.
3. Strong candles on weekly , monthly time frame.
4. Clear ichimoku lag span level on weekly , daily time frames.
5. If it breakout , potential to reach 1400 ; 1500 next coming weeks. Safe entry above 1280.
6. If it breakdown can reach supportive trend line again.
This view shared for educational purposes only. Consult your financial advisor before entering trades.

IndusIndBk Chat Pattern After analyzing IndusIndBk's stock, there are indications that a potential breakout may occur in the near future. Several factors suggest that the stock's price could experience a significant movement.
However, it's important to note that stock market investments come with inherent risks, and predicting breakouts or price movements accurately is challenging. It's advisable to consult with a financial advisor or conduct further research to validate the analysis and make informed investment decisions.

Indusindbank looking good for 1-2 % moveIndusindbank is having a good strength and it will give 1-2 % in 2-4 days

INDUSINDBK bullish flag intradayINDUSINDBK formed a bullish flag pattern in intraday. if it breaks 1135 level it can reach 1183.

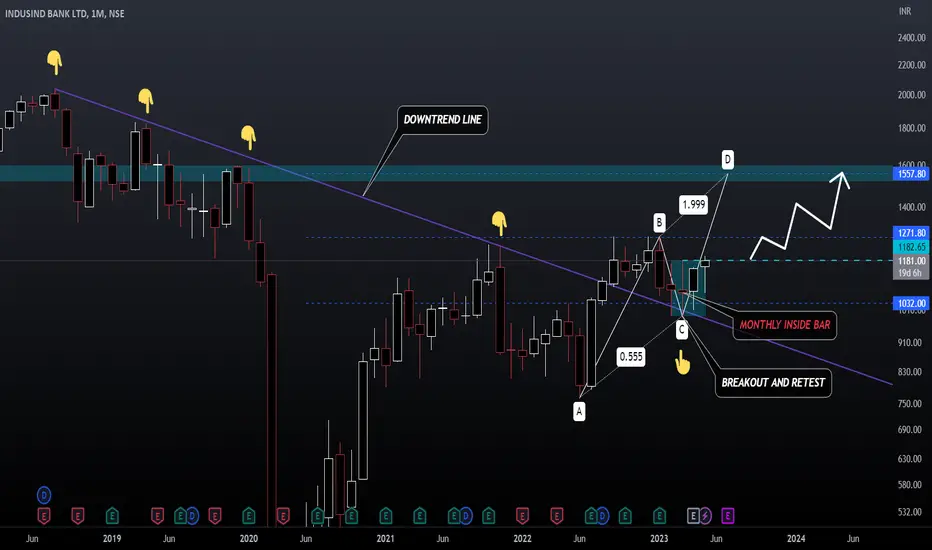
INDUSIND BANK INDUSIND BANK has broken out of its 5 year old downtrend line showing big buyers coming in the stock , retest of support is also done and the stock has formed a good inside bar candle in monthly time frame . Any breakout above the inside bar candle range will be a confirmation of upcoming rally in the stock , ie levels of 1180 , one can go long above this range if a weekly candle closes above it for targets of 1500 levels in medium to long term