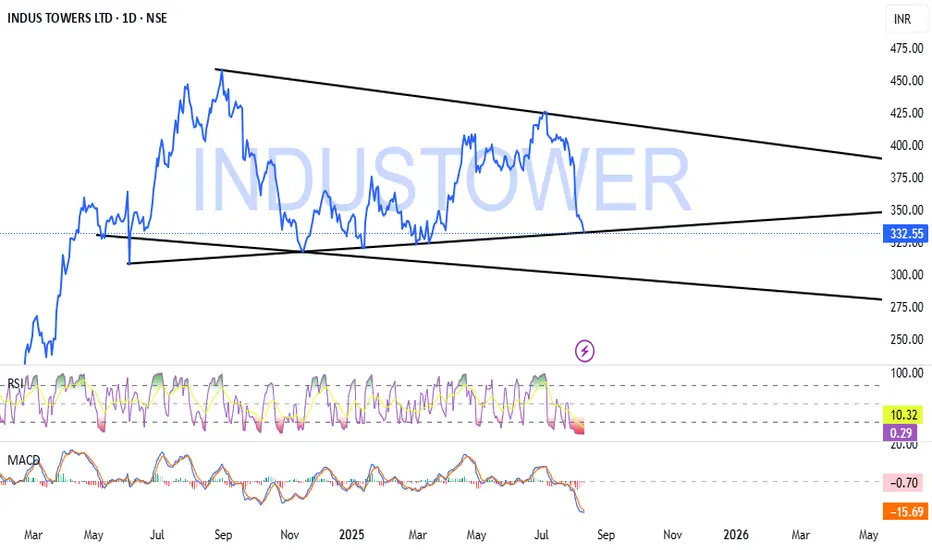
IndusTower Long - Forming Pattern & Entering into consolidationIndusTower - After the decent Breakout Forming Pattern & Entering into consolidation. Its Best buy at Bottom with Stoploss.
Righttime to enter before Breakout.
Do your own analysis before Entering into any trade. NSE:INDUSTOWER
Next report date
—
Report period
—
EPS estimate
—
Revenue estimate
—
36.80 INR
99.32 B INR
301.23 B INR
1.24 B
About Indus Towers Limited
Sector
Industry
CEO
Prachur Sah
Website
Headquarters
Gurugram
Founded
2006
ISIN
INE121J01017
FIGI
BBG003CZKCD9
Indus Towers Ltd. engages in the provision of telecom tower infrastructure for telecommunication services. It operates through the Infratel and Proportionate Share of JV. The company was founded on November 30, 2006 and is headquartered in Gurugram, India.
Related stocks
Indus towers making plans to take on its bull run.With breaking its 50-period moving average on 17th November 2020 which is on a recovery time after the covid crisis, Indus towers have shown very good resistance since then. If the market resists during the second or third wave (called by some), this stock is truly a long-term pick.
Given its quarte

INDUS TOWER broke out of Double Bottom - Bullish DOUBLE BOTTOM breakout -
indus tower has recently broken out of double bottom. A double bottom is formed when 2 consecutive troughs are formed and the neckline is at the same level as the joining line of the 2 troughs. price has broken out of this neckline indicating strong upward potential
BOL

INDUS TOWER AT WEEKLY BREAKOUTIf you are loking for long you can take a chance after breakout sustained.
> here i ploted green line as support.
> Red line is as support.
now what to do you have to decide. this is just for information.

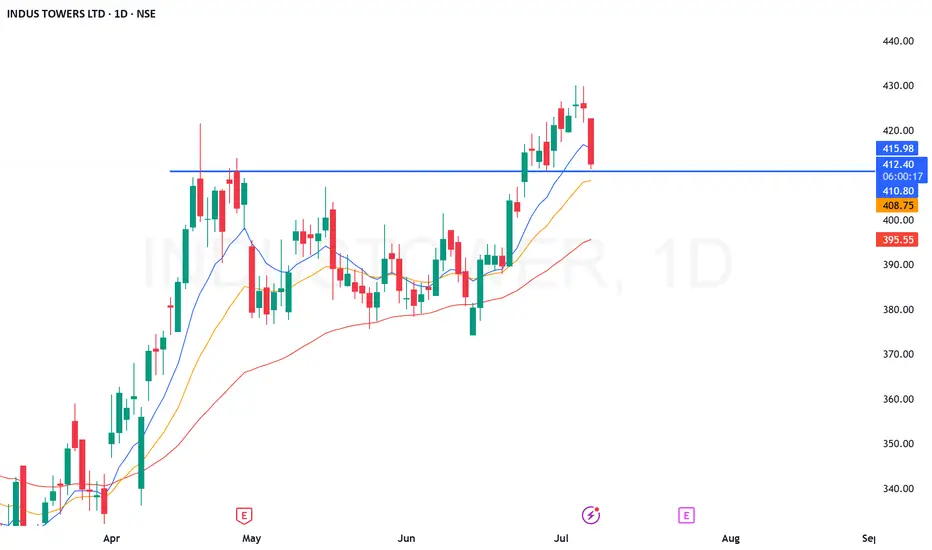
INDUS TOWERS LTD – Daily Chart Setup 📌 INDUS TOWERS LTD – Daily Chart Setup
🔹 *Tight Base After Breakdown – Bounce or Breakdown?*
📅 Daily Chart Highlights:
• CMP: ₹407.50
• Price stabilizing after sharp fall from ₹426+
• Currently stuck between ₹400 (support zone) and ₹408.50–410 (resistance)
• Volume tapering off — indicating
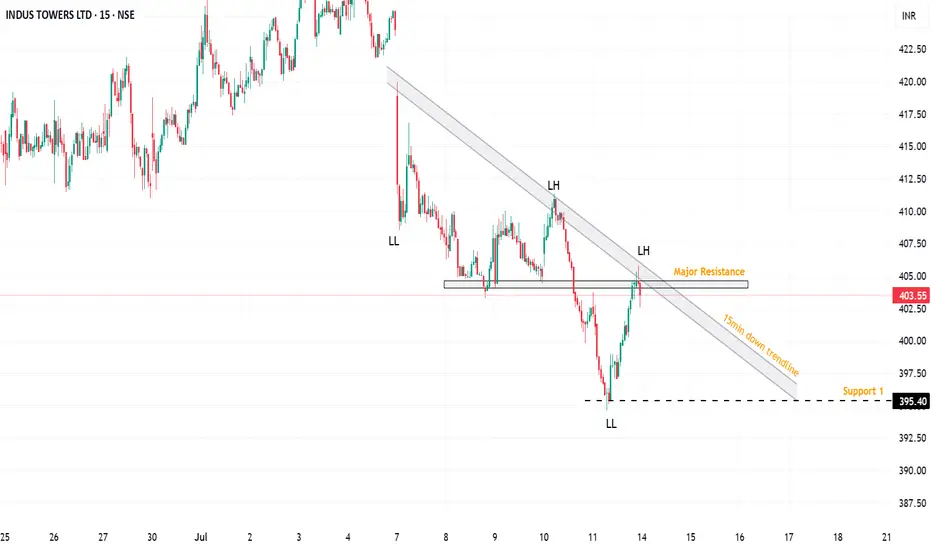
INDUSTOWER | 15-min Swing Idea – 14 Jul 2025📌 INDUSTOWER | 15-min Swing Idea – 14 Jul 2025
Bias: Bearish below 405; swing reversal above
CMP: 403.55
Market Structure
• Price forming LH–LLs under clear trendline resistance
• Support at 395.40; resistance at 405
Levels
│ R1 405.5 │ R2 410
│ S1 395.4 │ S2 388.0
Trade Plan
🟢 Breakout Long → En
Indus Towers ! Small Swing Possible ?Indus Towers Ltd is a leading telecom infrastructure provider in India, supporting mobile network operators with tower infrastructure across the country. With the ongoing 5G rollout and rising data consumption, the long-term outlook remains favorable.↳
🔍 Technical Setup
Price Action: The stock has

Indus tower Retesting NSE:INDUSTOWER
Retesting BO level and 20 EMA (orange)
Good to keep on the radar
Always respect SL & position sizing
========================
Trade Secrets By Pratik
========================
Disclaimer
NOT SEBI REGISTERED
This is our personal view and this analysis
is only for educational purpo
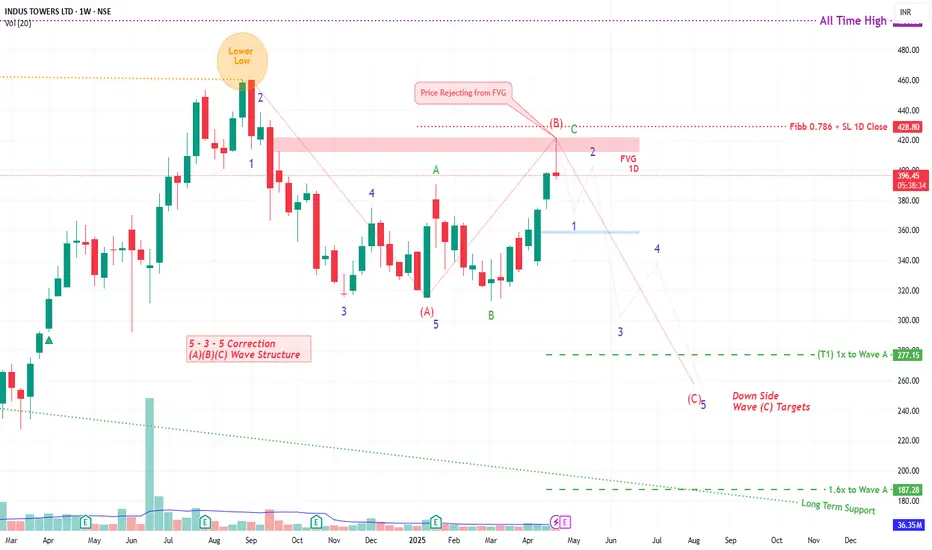
INDUS TOWER By KRS Charts25th April 2025 / 9:40 AM
Why INDUSTOWER??
1. Stock was reached its near ATH level but not able to hold the levels in Sep 2024 . From this point to today it seems like bullishness is getting weaker.
2. Wave Theory is saying Correction Wave ABC is ongoing and C is likely Started .
3.
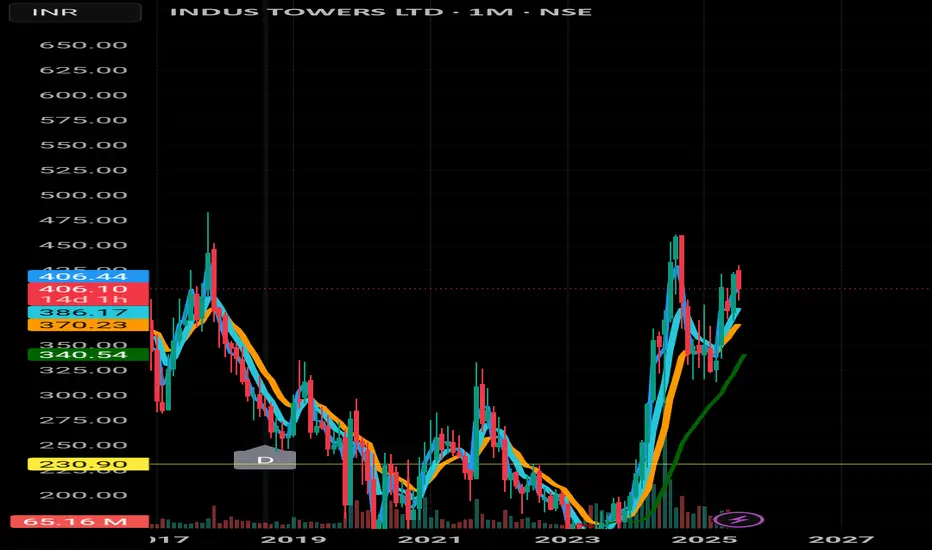
Indus Towers Limited (INDUSTOWER)Indus Towers Limited is India’s largest telecom tower infrastructure provider, with a market share of approximately 33% in towers and 42% in tenancies. Formed by the merger of Bharti Infratel and Indus Towers, the company supports the deployment of advanced cellular network technologies, focusing on

See all ideas
Summarizing what the indicators are suggesting.
Neutral
SellBuy
Strong sellStrong buy
Strong sellSellNeutralBuyStrong buy
Neutral
SellBuy
Strong sellStrong buy
Strong sellSellNeutralBuyStrong buy
Neutral
SellBuy
Strong sellStrong buy
Strong sellSellNeutralBuyStrong buy
An aggregate view of professional's ratings.
Neutral
SellBuy
Strong sellStrong buy
Strong sellSellNeutralBuyStrong buy
Neutral
SellBuy
Strong sellStrong buy
Strong sellSellNeutralBuyStrong buy
Neutral
SellBuy
Strong sellStrong buy
Strong sellSellNeutralBuyStrong buy
Displays a symbol's price movements over previous years to identify recurring trends.
Frequently Asked Questions
The current price of INDUSTOWER is 347.20 INR — it has increased by 0.26% in the past 24 hours. Watch Indus Towers Limited stock price performance more closely on the chart.
Depending on the exchange, the stock ticker may vary. For instance, on NSE exchange Indus Towers Limited stocks are traded under the ticker INDUSTOWER.
INDUSTOWER stock has fallen by −2.47% compared to the previous week, the month change is a 3.03% rise, over the last year Indus Towers Limited has showed a −11.55% decrease.
We've gathered analysts' opinions on Indus Towers Limited future price: according to them, INDUSTOWER price has a max estimate of 525.00 INR and a min estimate of 300.00 INR. Watch INDUSTOWER chart and read a more detailed Indus Towers Limited stock forecast: see what analysts think of Indus Towers Limited and suggest that you do with its stocks.
INDUSTOWER reached its all-time high on Aug 5, 2015 with the price of 499.65 INR, and its all-time low was 120.05 INR and was reached on Mar 19, 2020. View more price dynamics on INDUSTOWER chart.
See other stocks reaching their highest and lowest prices.
See other stocks reaching their highest and lowest prices.
INDUSTOWER stock is 1.73% volatile and has beta coefficient of 1.23. Track Indus Towers Limited stock price on the chart and check out the list of the most volatile stocks — is Indus Towers Limited there?
Today Indus Towers Limited has the market capitalization of 913.67 B, it has increased by 0.14% over the last week.
Yes, you can track Indus Towers Limited financials in yearly and quarterly reports right on TradingView.
Indus Towers Limited is going to release the next earnings report on Oct 29, 2025. Keep track of upcoming events with our Earnings Calendar.
INDUSTOWER earnings for the last quarter are 6.59 INR per share, whereas the estimation was 6.99 INR resulting in a −5.70% surprise. The estimated earnings for the next quarter are 6.89 INR per share. See more details about Indus Towers Limited earnings.
Indus Towers Limited revenue for the last quarter amounts to 80.58 B INR, despite the estimated figure of 80.92 B INR. In the next quarter, revenue is expected to reach 82.04 B INR.
INDUSTOWER net income for the last quarter is 17.37 B INR, while the quarter before that showed 17.79 B INR of net income which accounts for −2.38% change. Track more Indus Towers Limited financial stats to get the full picture.
Indus Towers Limited dividend yield was 0.00% in 2024, and payout ratio reached 0.00%. The year before the numbers were 0.00% and 0.00% correspondingly. See high-dividend stocks and find more opportunities for your portfolio.
As of Sep 29, 2025, the company has 10.73 K employees. See our rating of the largest employees — is Indus Towers Limited on this list?
EBITDA measures a company's operating performance, its growth signifies an improvement in the efficiency of a company. Indus Towers Limited EBITDA is 206.90 B INR, and current EBITDA margin is 69.20%. See more stats in Indus Towers Limited financial statements.
Like other stocks, INDUSTOWER shares are traded on stock exchanges, e.g. Nasdaq, Nyse, Euronext, and the easiest way to buy them is through an online stock broker. To do this, you need to open an account and follow a broker's procedures, then start trading. You can trade Indus Towers Limited stock right from TradingView charts — choose your broker and connect to your account.
Investing in stocks requires a comprehensive research: you should carefully study all the available data, e.g. company's financials, related news, and its technical analysis. So Indus Towers Limited technincal analysis shows the sell today, and its 1 week rating is sell. Since market conditions are prone to changes, it's worth looking a bit further into the future — according to the 1 month rating Indus Towers Limited stock shows the neutral signal. See more of Indus Towers Limited technicals for a more comprehensive analysis.
If you're still not sure, try looking for inspiration in our curated watchlists.
If you're still not sure, try looking for inspiration in our curated watchlists.