IOB can rise after PSU stake saleI feel that all PSU banks are well positioned to move up
The ones that have the highest chances of getting sold off are IOB, central Bank as of now
Rumours of their Privatisation have been going around for a while
Indian Overseas Bank
No trades
2.57 INR
33.96 B INR
337.49 B INR
1.46 B
About Indian Overseas Bank
Sector
Industry
CEO
Ajay Kumar Srivastava
Website
Headquarters
Chennai
Founded
1937
IPO date
Sep 5, 2003
Identifiers
2
ISIN INE565A01014
Indian Overseas Bank engages in the provision of commercial banking services. It operates through the following business segments: Treasury, Corporate or Wholesale Banking, Retail Banking, and Other Banking Operations. The company was founded by Muttaiya Chidambaram Chettiar Chettyar on February 10, 1937 and is headquartered in Chennai, India.
Related stocks

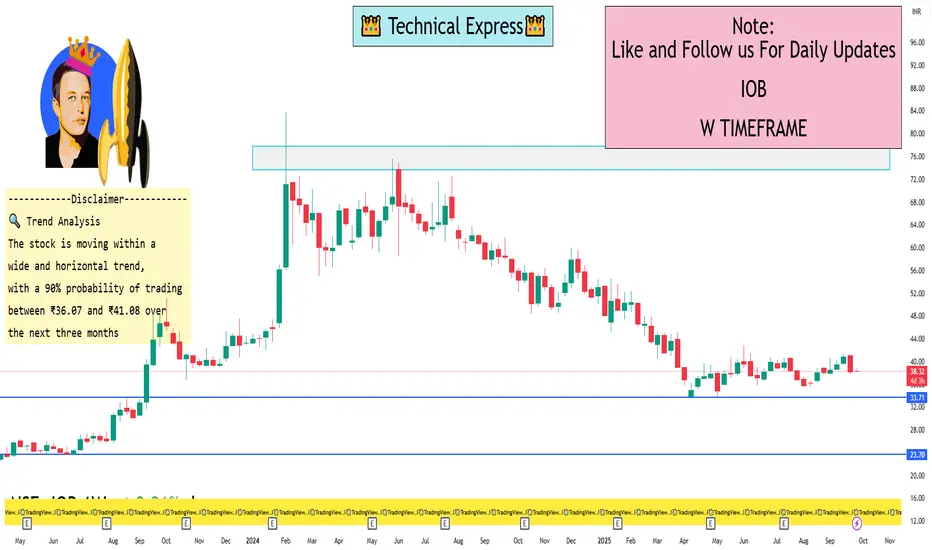
IOB 1 Week View📊 Key Technical Indicators
Moving Averages: The stock is trading below its 5-day, 50-day, and 200-day moving averages, all indicating a sell trend.
Relative Strength Index (RSI): The 14-day RSI stands at 39.62, suggesting the stock is in a neutral to bearish condition.
MACD: The MACD is negative
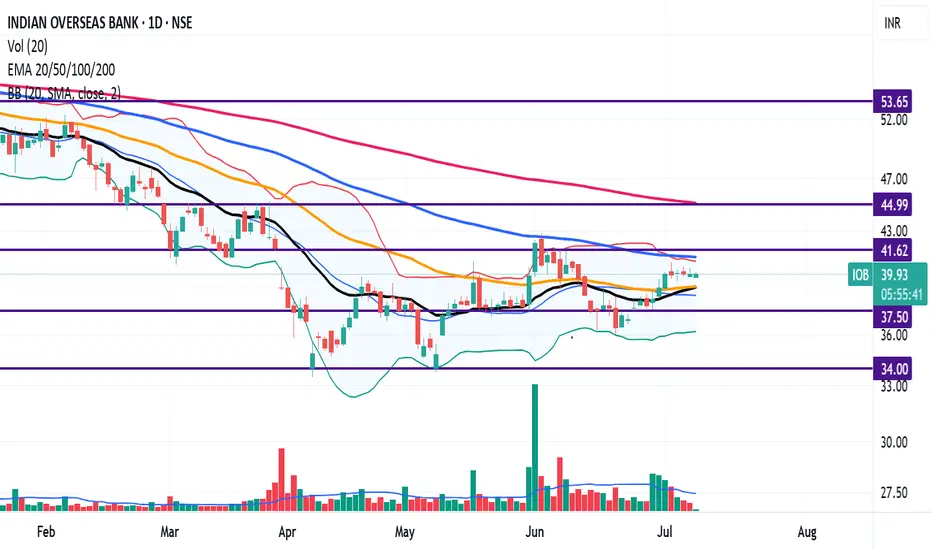
Stock turning Bullish: Indian Overseas Bank (IOB)IOB is taking strong support around 20 EMA (Black Line),
We can confirm the bullish trend in the stock when 20 EMA (Black Line) cross above 50 EMA (Orange Line) decisively in the weekly chart.
IOB is 44.86% away from 52 week high and
19.49% away from 52 week low
The stocks is showing Mid Range M
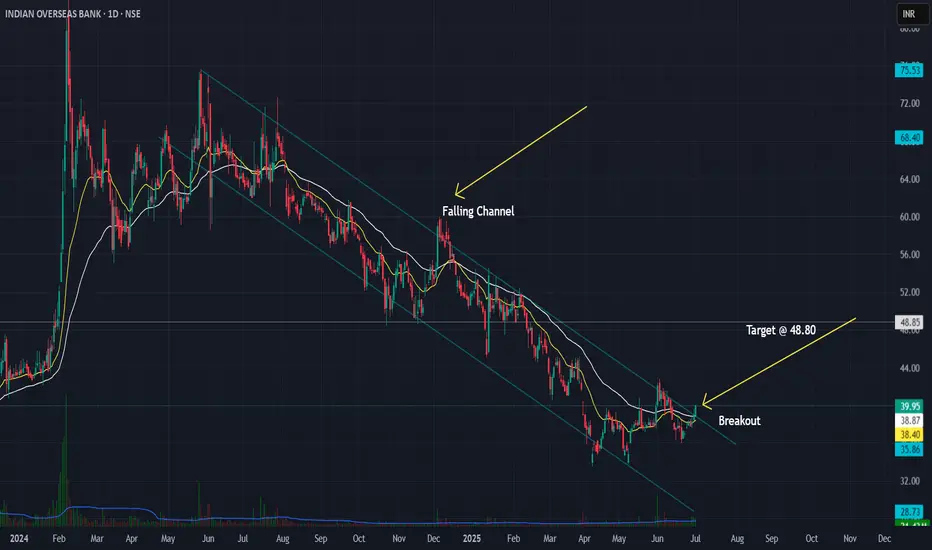
Indian Overseas Bank (IOB) - Falling Channel Breakout Setup📈 Indian Overseas Bank (IOB) – Falling Channel Breakout Setup
Watching a classic falling channel on the daily timeframe with multiple touches on both trendlines. Recent breakout above ~38.8 confirms the channel break.
✅ Planned Trade Details:
- Entry above 38.8 (confirmation)
- Stop-loss: 35.90
-
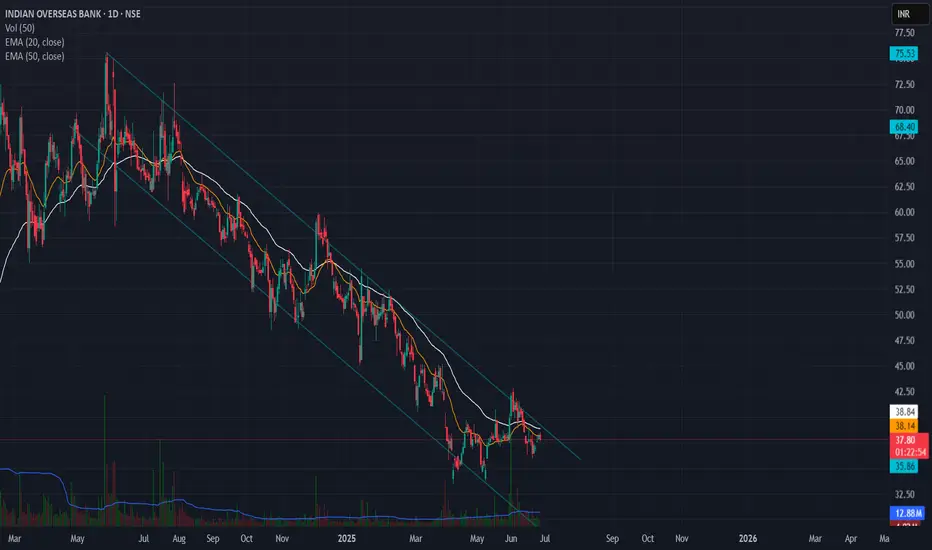
Falling Channel Pattern in Indian Overseas Bank📉 IOB (Indian Overseas Bank) - Falling Channel Setup
🔍 Daily Chart Analysis – June 26, 2025
IOB has been trading within a well-defined falling channel since early 2024. Price is currently testing the upper boundary of the channel but hasn’t confirmed a breakout yet.
🔑 Key Observations:
Structure:
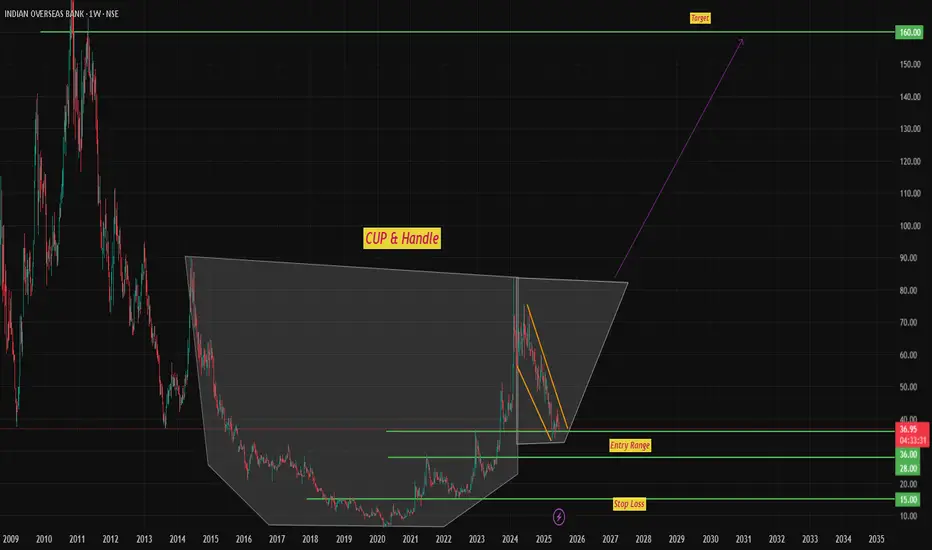
Weekly cup & Handle patternIndian Overseas Banks, weekly time frame formed Cup and Handle pattern.
IOB has made progress in improving its financial health, particularly in reducing NPAs and increasing profitability. However, it needs to address the challenges related to ROA, cost-to-income ratio, and fluctuating quarterly re
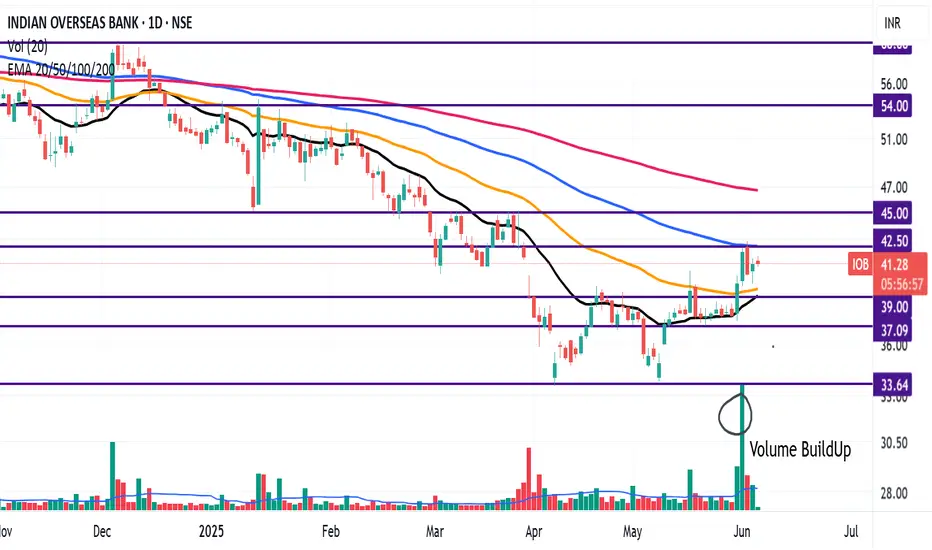
Turning Bullish: IOBIOB is trading above 20 EMA (black Line), 50 EMA (Orange Line), and nearing the 100 EMAs (Blue Line) However, it is well below the 200 EMA (Pink line).
Recently the stock turned bullish, after taking support around 20EMA.
Volume Buildup also confirms the change in trend.
We have seen spurt in volu
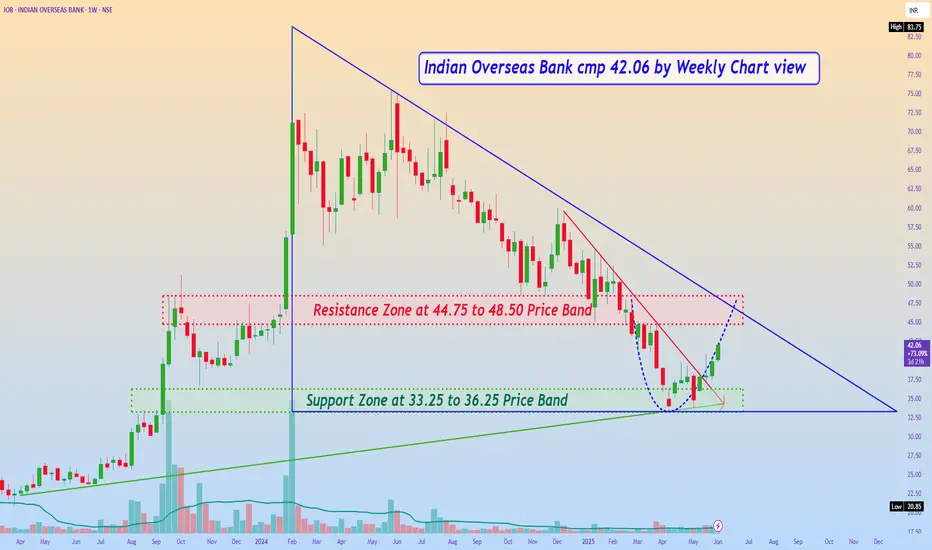
Indian Overseas Bank cmp 42.06 by Weekly Chart viewIndian Overseas Bank cmp 42.06 by Weekly Chart view
- Support Zone at 33.25 to 36.25 Price Band
- Resistance Zone at 44.75 to 48.50 Price Band
- Volumes are seen increasing gradually week over week
- Bullish Rounding Bottom in the making at Resistance Zone neckline
- Chart setup indicates a Descend
IOB - Progressive Cup & Handle - QuarterlyGood Progressive Cup & Handle Formation. Handle is yet to form a definite shape but it will soon.
Can accumulate at this levels and wait till the breakout above 65.
Target 1 122 in about 6-8 months
Target 2 142 in about 12 months
Please do check the fundamentals though.

The trend is strong IOB CM 52.14
Fibs- the retracement to 50% of the swing is strength. This means the trend is intact and strong.
Trendline- break of the falling trendline and retest is positive.
RSI- +ve divergence at support is indication of reversal. On the second dip the RSI is now taking support above the bull

See all ideas
Summarizing what the indicators are suggesting.
Oscillators
Neutral
SellBuy
Strong sellStrong buy
Strong sellSellNeutralBuyStrong buy
Oscillators
Neutral
SellBuy
Strong sellStrong buy
Strong sellSellNeutralBuyStrong buy
Summary
Neutral
SellBuy
Strong sellStrong buy
Strong sellSellNeutralBuyStrong buy
Summary
Neutral
SellBuy
Strong sellStrong buy
Strong sellSellNeutralBuyStrong buy
Summary
Neutral
SellBuy
Strong sellStrong buy
Strong sellSellNeutralBuyStrong buy
Moving Averages
Neutral
SellBuy
Strong sellStrong buy
Strong sellSellNeutralBuyStrong buy
Moving Averages
Neutral
SellBuy
Strong sellStrong buy
Strong sellSellNeutralBuyStrong buy
Displays a symbol's price movements over previous years to identify recurring trends.
90802IOB19
Indian Overseas Bank 9.0802% 24-SEP-2029Yield to maturity
10.49%
Maturity date
Sep 24, 2029
780IOB36
Indian Overseas Bank 7.8% 23-JAN-2036Yield to maturity
—
Maturity date
Jan 23, 2036
860IOB32
Indian Overseas Bank 8.6% 31-MAR-2032Yield to maturity
—
Maturity date
Mar 31, 2032
9IOB33
Indian Overseas Bank 9.0% 24-MAR-2033Yield to maturity
—
Maturity date
Mar 24, 2033
See all IOB bonds
MIDCAPETF
Mirae Asset Nifty Midcap 150 ETF Exchange Traded Fund UnitsWeight
0.14%
Market value
208.10 K
USD
PSUBNKIETF
ICICI Prudential Nifty PSU Bank ETF Exchange Traded Fund UnitsWeight
1.41%
Market value
140.81 K
USD
Explore more ETFs
Frequently Asked Questions
The current price of IOB is 34.81 INR — it has decreased by −0.03% in the past 24 hours. Watch Indian Overseas Bank stock price performance more closely on the chart.
Depending on the exchange, the stock ticker may vary. For instance, on NSE exchange Indian Overseas Bank stocks are traded under the ticker IOB.
IOB stock has risen by 0.87% compared to the previous week, the month change is a −4.66% fall, over the last year Indian Overseas Bank has showed a −32.76% decrease.
IOB stock is 2.01% volatile and has beta coefficient of 1.73. Track Indian Overseas Bank stock price on the chart and check out the list of the most volatile stocks — is Indian Overseas Bank there?
Today Indian Overseas Bank has the market capitalization of 670.71 B, it has increased by 1.18% over the last week.
Yes, you can track Indian Overseas Bank financials in yearly and quarterly reports right on TradingView.
IOB net income for the last quarter is 14.27 B INR, while the quarter before that showed 12.59 B INR of net income which accounts for 13.37% change. Track more Indian Overseas Bank financial stats to get the full picture.
No, IOB doesn't pay any dividends to its shareholders. But don't worry, we've prepared a list of high-dividend stocks for you.
As of Feb 8, 2026, the company has 20.97 K employees. See our rating of the largest employees — is Indian Overseas Bank on this list?
Like other stocks, IOB shares are traded on stock exchanges, e.g. Nasdaq, Nyse, Euronext, and the easiest way to buy them is through an online stock broker. To do this, you need to open an account and follow a broker's procedures, then start trading. You can trade Indian Overseas Bank stock right from TradingView charts — choose your broker and connect to your account.
Investing in stocks requires a comprehensive research: you should carefully study all the available data, e.g. company's financials, related news, and its technical analysis. So Indian Overseas Bank technincal analysis shows the sell today, and its 1 week rating is sell. Since market conditions are prone to changes, it's worth looking a bit further into the future — according to the 1 month rating Indian Overseas Bank stock shows the sell signal. See more of Indian Overseas Bank technicals for a more comprehensive analysis.
If you're still not sure, try looking for inspiration in our curated watchlists.
If you're still not sure, try looking for inspiration in our curated watchlists.