IOC trade ideas


IOC LOOKS GOODIndian Oil Corporation is looking good by breaking a falling resistance trendline and a horizontal trendline too and gives a close above on both trendlines on weekly chart so we can consider it is a breakout and can go long in it for the target of 88 and 93 so after this breakout i am expecting it comes to retest it's breakout zones which is near about 83 to 82 zones and if come and bounce from there we can go long in this execution we will take a stop loss of below 80 on weekly close basis.
NOTE- Only for Education Purpose.
Please Give A Like If You Like

IOCENTRY TARGET SL Mention in the chart.
ALWAYS TAKE TRADE WITH CONFIRMATION
Note : Trading in any financial market is very risky. I post ideas for educational purpose only. It is not financial advice. Do not hold us responsible for any potential loss you may incur. Please consult your financial adviser before trading.

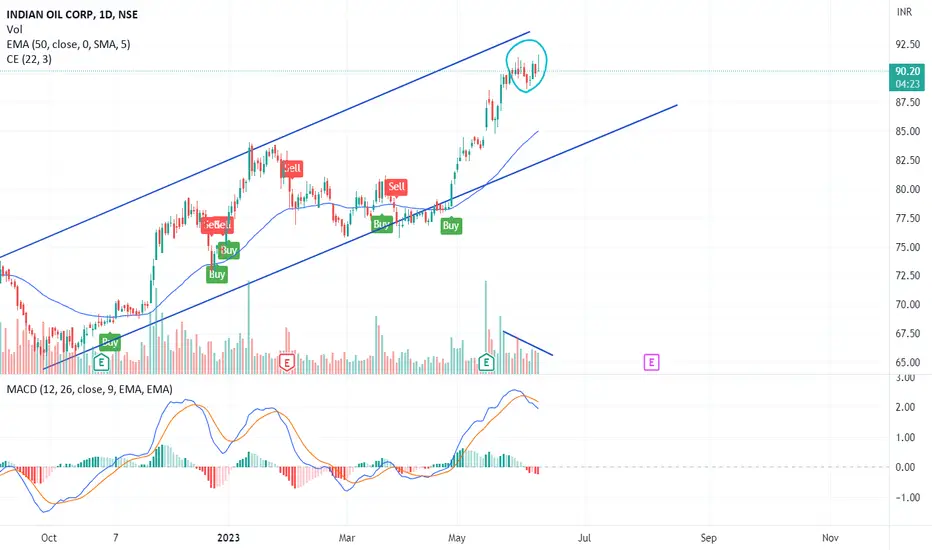
IOC Reversal trendIOC stock from May 30 as of now seller are not letting the price to go up. The last few day can we see more wicks than body the seller dominating...
volume also reducing...
Target 1 (85.30) and Target 2 (83.30)
This is content is for educational purpose and not for investment purpose.
Iam not SEBI registered....
please do your own analysis...
IOC might be wave in wave 3 | Swing TradeIOC min target 1 if breaks 91.4 with stop loss given in chart.
Stock looks to be in wave 3 with should be 100% of wave 1 and more than 100% if extended.
Disclaimer : Not an investment or trading advice. Please do your own research and analysis before putting money.

IOC - 1 Hour | Both side posibilitiesIndian Oil Corporation - IOC Analysis in 1hr Timeframe
It forms both W Pattern and a Head and shoulder pattern. We should take entry on confirmation of breakout only.
Case1: If Price breaks neckline of W Pattern we can go for buy
Case 2: If price breaks the support and confirms the breakout from head and shoulder will go for Sell Position.
Both side possibilities explained in the short video. Please watch it completely. Thanks.

VIEW ON IOCGood chart
Stock n a good move
Above its APRIL 22 HIGHS
Target 93/97
Stop loss 87
I am just representing my views
For educational purpose only.

#IOC BO Analysis Stock is trading near weekly/ monthly TF breakout with good volume build up, if sustain above BO level, entry and exit as per marked level.

IOC LOOKING GOOD TO ENTERIOC
CMP : 86
DISCLAIMER - We are not a SEBI Registered Advisors. This channel is purely for Educational purposes only. We will not be responsible for your profit and loss.

IOC - CASHThere can be a breakout coming on daily chart of IOC. As the stock trying to break resistance of 80.85-81.15
We can create a long position and expect a target of 85-86 with a stop loss at 80.50-80.30

IOC stock break out A fresh break out of IOC can be sen today on charts after the long consolidation. Levels of 95-100+ can be seen in the coming days. Keep the stock in your watchlist. This is for your educational purpose only.

IOC looking bullish (08/05/23).IOC on the weekly time frame seems to be at a prefect place for buying. The stock has given a break out of the parallel channel and is holding on the upper levels.
A nice bullish moving average crossover is there on the weekly charts, which indicates the bullishness the stock can show in coming weeks.
Stock holded the 20 ema after the break out of the moving average and gave a nice movement after a consolidation.
Buying opportunity will come on the lower levels, as it may test the parallel channel and start new bullish leg.
3 point confirmation.
1. Bullish moving average crossover (weekly).
2. Parallel channel break out and a retest.
3. Trading above both the EMAs (daily).
Support :- 81
Resistance :- 84, 93
Let the stock retest a support levels or forms a price action after the break out of 84 levels.
The support level is in confluence with the fibonnaci levels.
Wait for the price action near the levels before entering the trade.
Stock can be bought near the levels and for swing trades F&O can also be traded.


IOC Short 83.6 May SeriesThe Weekly Time Frame Suggest a Strong Supply Area, (Already Tested Once but still can Drag price down upto 20 EMA @79.2
Plan a Short Trade
Either on Intraday Basis or Options.
PS: This research is entirely for Education Purpose, your all capital may get wiped out. Trade Carefully.
I am not responsible either for your Loss or Gains.

IOC Breakout with huge volumeIOC gave a breakout to resistance with a strong volume and presently having cup and handle design pattern
Breakout above 85 would give a target of 92+
More over MRCL gave a good returns and IOC having major stakes in it, we may expect good results on May 16th and have good dividend given after board meeting
#IOC #1W #CUPANDHANDLE #CUP&HANDLE


IOCIOC has taken multiple support and resistance between 68 and 73 range.
This could be a good range to trade short term

Targets for iocl ...So clearly we can see the stock has break the resistance of 79 after testing it for the third time fron here the targets would be 84 and after that re-test for the support of 80. the stock is going to fly the target for the end of this would be 100 these are the possibilities im expecting from it........

IOC High divided stock market or break in 1W tfIOC is having strong resistance in weekly timeframe, giving a breakout would lead to good bounce for short term.

IOCLIt getting tighter and tighter in weekly time frame. Any breakout above 78.50 can give good upside.

IOC bullish patternIOC analysis every thing memtion on chart
NOTE: THIS IS FOR EDUCATION PURPOSE ONLY DO UR OWN RESEARCH BEFORE MAKING ANY INVESTMENT

IOC Bullish; above 81 on Tuesday 21 Mar for IntradayExercise caution as broader market is bearish.
Please check out the INTRADAY Trading Strategy in the COMMENTS section below during the live market hours:
---------------------------------------------------------------------------------------------------------------------
1) Impulse upmove stage: The strong upmove (nearly upto 2% from breakoutprice) happens within the first five to 15 minutes. "High Risk Traders" buys in hope of another 2% upmove intraday.
"High Risk Traders" may have to patiently wait through the Pullback-Consolidation stage to realize profits. High risk/High reward set up as breakouts may fakeout (reversal)also
2) Pullback-Consolidation stage: After the above "Impulse upmove stage"; the price may then pull back and move sideways (between "Open" price and "High" of the above "Impulse upmove stage").
Safe traders with minimum risk profile may Wait for a breakout from the consolidation to enter at this stage to relize high profits in the final intraday final "Breakout continuation" stage
3) Breakout continuation: Stocks often in the third stage breaks up above the "High" of the first "Impulse upmove stage" and continue to go higher again.
Both Safe Traders/High Risk Traders may book profits at this stage
Stop Loss: You may keep the stop loss @ "Open" price of the day OR "Breakoutprice"
The above information is not meant to be, and do not constitute, financial, investment, trading, or other types of advice or recommendation.
