JINDALPHOT - Short Term Buy - Rising StrengthJINDALPHOT - SHORT TERM BUY
KEY OBSERVATIONS
Rising Strength
Volume Building
At its all time High
Trade ideas
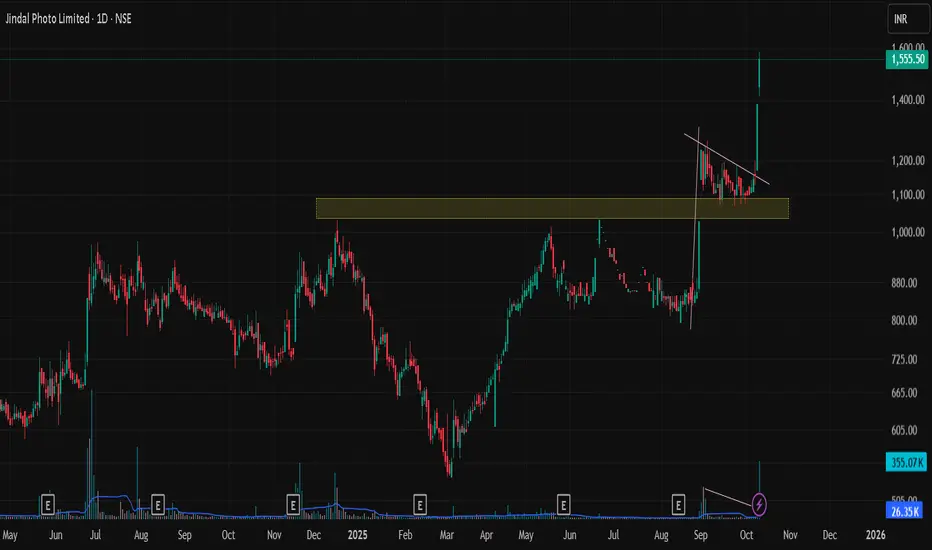
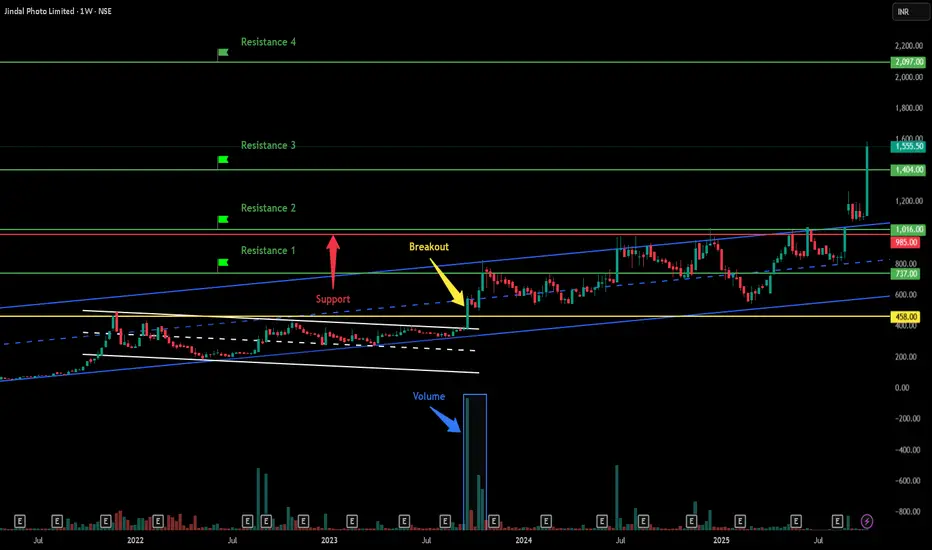
Jindal Photo Limited - Breakout Setup, Move is ON...#JINDALPHOT trading above Resistance of 1404
Next Resistance is at 2097
Support is at 985
Here are previous charts:
Chart is self explanatory. Levels of breakout, possible up-moves (where stock may find resistances) and support (close below which, setup will be invalidated) are clearly defined.
Disclaimer: This is for demonstration and educational purpose only. This is not buying or selling recommendations. I am not SEBI registered. Please consult your financial advisor before taking any trade.
#JINDALPHOT - IHNS BreakOut in Daily chart.📊 Script: JINDALPHOT
Key highlights: 💡⚡
📈 IHNS BreakOut in Daily chart.
📈 Price gave a good up move and consolidated before BO.
📈 Volume spike on Breakout
📈 MACD Cross Over
📈 One can go for Swing Trade.
BUY ONLY ABOVE 1000 DCB
⏱️ C.M.P 📑💰- 986.35
🟢 Target 🎯🏆 – 21%
⚠️ Stoploss ☠️🚫 – 10%
⚠️ Important: Always Exit the trade before any Event.
⚠️ Important: Always maintain your Risk & Reward Ratio.
✅Like and follow to never miss a new idea!✅
Disclaimer: I am not SEBI Registered Advisor. My posts are purely for training and educational purposes.
Eat🍜 Sleep😴 TradingView📈 Repeat 🔁
Happy learning with MMT. Cheers!🥂

Approaching Symmetrical Triangle Breakout – Bullish SetupThe stock is forming a symmetrical triangle, nearing the apex, which suggests a potential breakout.
The RSI is at 57.40, indicating positive momentum and a potential for further upside.
The MACD shows a bullish crossover, with the histogram turning positive, suggesting increasing bullish momentum.
Volume has been increasing, adding confirmation to the potential breakout scenario.
Immediate resistance is around ₹760, with support at the lower trendline around ₹620.
A breakout above ₹760 with strong volume could lead to a significant bullish move. Watch for confirmation of the breakout for potential entry points.

JINDALPHOTO BULLISH BREAKOUTIts a up flag breakout.Breakout is happened after a long consolidation with huge volume

About [ edit ] Incorporated in 1986, Jindal photo Ltd is engag
Market Cap ₹ 702 Cr.
Current Price ₹ 685
High / Low ₹ 823 / 263
Stock P/E 3.17
Book Value ₹ 2,011
Dividend Yield 0.00 %
ROCE 8.70 %
ROE 8.76 %
Face Value ₹ 10.0
Graham ₹ 3,118
Intrinsic Value ₹ 2,505
EPS ₹ 215
Sales growth 10,022 %
Sales last year ₹ 7.87 Cr.
Sales growth 3Years 293 %
Profit growth 11.0 %
Profit Var 3Yrs 271 %
Profit Var 5Yrs 162 %
Return on equity 8.76 %
Profit Var 7Yrs 15.8 %
Sales 2Qtr Bk ₹ 0.45 Cr.
ROE 7Yr %
Debt ₹ 69.0 Cr.
Current assets ₹ 52.2 Cr.
Current liabilities ₹ 19.5 Cr.
Book value ₹ 2,011
Free Cash Flow 5Yrs ₹ -1.92 Cr.

Getting ready for massive breakout With a great previous journey of JINDAL PHOTO to it's investors , it's getting ready again for a massive breakout

JINDALPHOTO - Weekly Chart AnalysisA new ATH and breakout from the resistance/supply zone 416-485 levels with insane volumes.
A consolidation of almost 10 months. between the supply & demand zone.
Now it shall sustain above these levels. It is trading above all its key moving averages.
As per the trend based fib 650 - 780 - 945 are the levels that can be tested if sustained.
The previous supply zone/resistance shall now act as support/demand zone. (416-485) and weekly close below these levels shall invalidate our view.
Disclaimer: This is just an analysis and not a buy/sell recommendation. If you intend to trade this counter then do your own due diligence and trade at your own risk.

Cup & Handle set up to trade1. Cup & Handle Pattern
2. Trend is bullish
3. Stock is ATH
4. 1.5 years consolidation

Go Long in Jindal PhotoA bullish flag & pole Chart Pattern Breakout completed on the Daily Time frame of NSE:JINDALPHOT
Price Action supported by very good volume.
The stock is currently in uptrend making higher highs and higher lows.
One can add this stock into their stocks to buy list and initiate the long trade as per the levels mentioned on the chart
Stop loss will be on a Daily closing basis.
Trend Analysis :- UP Trend
Chart Pattern :- Bullish flag & pole Chart Pattern
Technical Indicator :- Positive MACD Crossover
Disclaimer: This is for educational purpose only.

JINDAL PHOTO - VCP breakout incomingJINDAL PHOTO has formed a VCP pattern after a good impulse move, after a good time correction, I think it is ready to move again, also all holding companies such as #JSWHL, #PILANIINVS, #NSIL, #BFINVEST are showing good strength and are near their all time high pivot zone. Do look at these names.
Ideal Stoploss is 330.
*DISCLAIMER*
This analysis is only for educational purpose. I am not a SEBI Registered Analyst/Advisor. Please consult your financial advisor before taking any position and please use a Stop Loss for any Investments/Trading Positions. It is your hard earned money so give risk management your highest attention. Do take this disclaimer seriously.

Jindal Photo Analysis Stock has given strong BO on daily and weekly chart with good volume, follow chart for proper support and resistance levels.

JINDALPHOT - Weekly AnalysisIn the Weekly Chart of JINDALPHOT ,
we can see that, it has given Triangle breakout.
Let it retest and then enter with SL and Targets.
Expected momentum is shown in chart.

JINDALPHOT - Weekly AnalysisIn the Weekly Chart of JINDALPHOT ,
we can see that, it is inside a Triangle and Hammer Candle is formed .
Expected momentum is shown in chart.


Jindal Photo: Rounding Bottom BreakoutNSE:JINDALPHOT has a nice, copy-book rounding bottom formation.
It has the following properties in the chart:
A perfect Rounding Bottom formation.
A perfect ascending triangle formation.
Buy above 420 with a SL to the neckline of the rounding bottom (i.e. 400). Below that the SL can be revised to 394.

JindalPhoto Flag BO possible#JindalPhoto CMP 381 a tight flag BO possible.
Can be added for 415/460/500 SL 335
