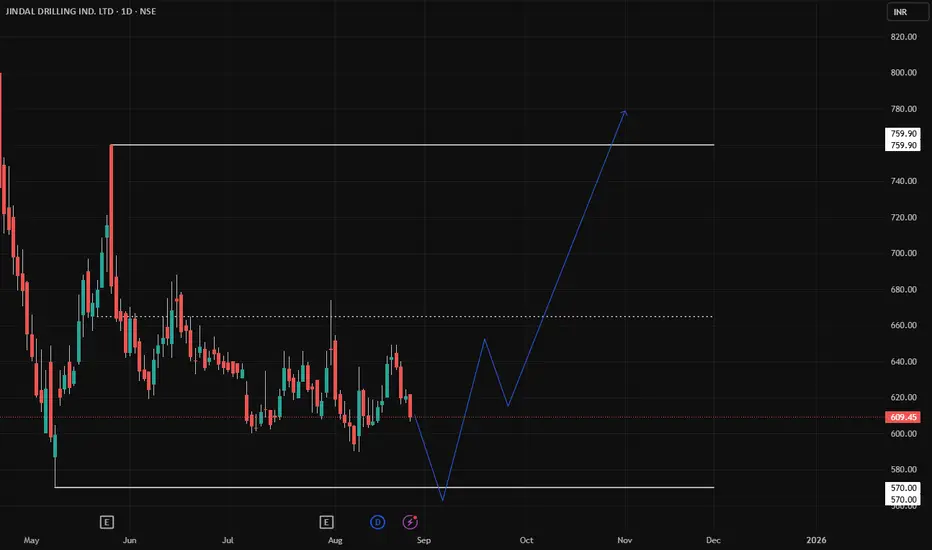
JINDRILL HTF Swing Trade SetupJINDRILL is currently trading within a range between ₹570 – ₹760.
Price is hovering near the lower band of this range. We can get a good long setup here if the level holds or shows a strong rejection.
JINDRILL trade ideas
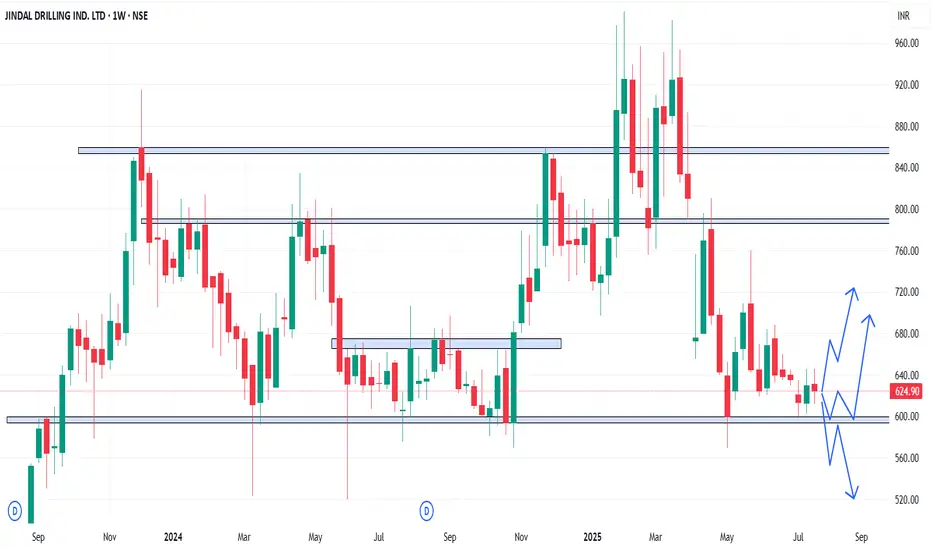
JINDRILL - Weekly AnalysisIn the Weekly Chart of JINDRILL ,
we can see that, it is at decision making point.
Possible momentums are shown in chart.
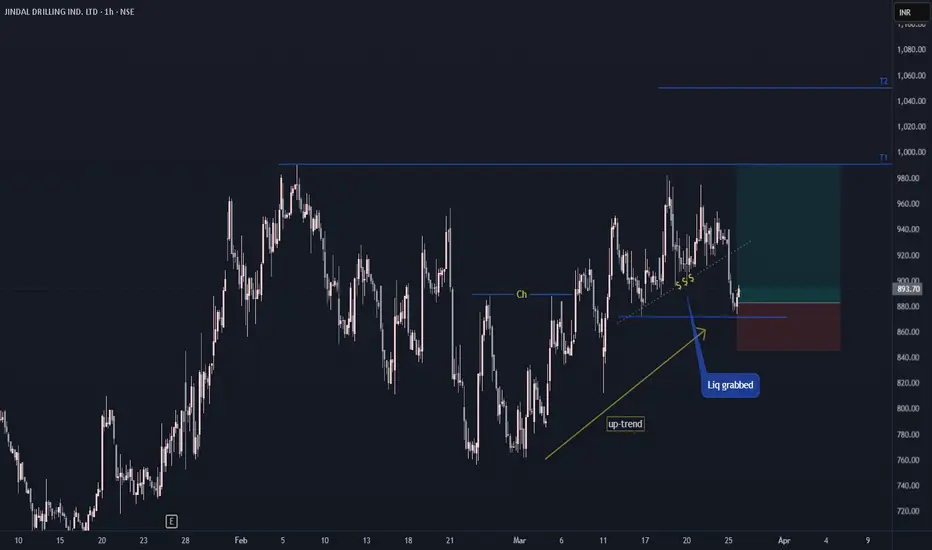
JINDRILL Swing Trade (1H)JINDAL DRILLING is in up-trend in 1H time frame and has grabbed liquidity which can fuel next up-move if Nifty holds current level of 23400.
Follow for more such trading ideas. Thanks. Happy Trading!
Stock Analysis: Jindal Drilling & IndustriesIntroduction:
Jindal Drilling & Industries, part of the Dharam Pal Jindal Group, is a leading Indian company in offshore drilling and allied services, including directional drilling and mud logging.
Fundamentals:
Market Cap: ₹ 2,533 Cr.;
Stock P/E: 19.6 (Ind. P/E: 21.07 ); 👍
ROCE: 6.52 % 👎;
ROE: 3.8% 👎;
3 Years Sales Growth: 16% 👍;
3 Years Profit Growth: 124% 👍;
3 Years Stock Price CAGR: 69% 👍
Cons: Company has a low return on equity of 5.64% over last 3 years.
Poor cash generated from core business.
Declining cash Cash Flow from Operations for last 2 years
Technicals:
Jindal Drilling & Industries is bullish as per the chart with 20EMA (Black line)>50EMA (Orange line)> 100EMA (SkyBlue line)>200EMA (Pink line)
Today, it gave a strong breakout with volume.
Resistance levels: 890, 940, 979
Support levels: 815, 755, 698

multiple timeframe breakout candidate JINDAL DRILLJindal Drilling, incorporated in 1983 is a Small Cap company (with a market cap of Rs. 2474.84) operating in Gas & Petroleum sector.
The Return of Equity (ROE) in last five financial years given by Jindal Drilling stock was 3.75%, 7.39%, 5.39%, -0.52% and -46.29% respectively.
The Jindal Drilling share gave a 3 year return of 585.9% as compared to Nifty 50 which gave a return of 41.5%.
Jindal Drilling announced 10.0% final dividend on August 14, 2024.

JINDRILL3.
➡️highest ever sales
➡️breakout is facing rejection from the top and needs a bullish candle
➡️improvement in financials primarily through group companies
➡️new rig awaiting deployment which will increase future sales and earnings
➡️contracts with ONGC (the dependency is also a weakness)

JINDRILL - Triangle BreakoutPrice consolidate since September 2023 and it breakout the triangle yesterday. It seems neat in both Day timeframe and Weekly timeframe.

Stock is Ready for Big Breakout NSE:JINDRILL
JINDAL DRILLING IND. LTD is showing a strong upward trend with a recent surge from 600 to 800. The stock broke out of a resistance level at 700 and has held a strong demand zone at 600. Rising volume trend indicates increasing interest in the stock.
The chart suggests a bullish view, but trading/investing always carries risk. So trade on your own risk. This Chart only for educational purpose.

JINDRILL Trade set up1. Set up: Triangle set up
2. Trend: Bullish
3. RR: Lurcartive : 1: 7+
3. Strength: Strong


Jindal Drilling retesting after 16 yearsJindal Drilling retesting the resistance of 800 after 16 years. Keep a watch for upside of 15% on breakout.
This is for educational purpose, consult your financial advisor before investing.

Jindal Drilling Analyasis on 06 May 24Jindal Drilling Analyasis on 06 May 24
stock PE is less than industry PE
buying level 680 to 730 (add 50%)
stock is near breakout level above 800
add 50% quantity if stable above 800
target 900 - 1050 - 1200 - 1350
Breakout target @ 1384

BUY TODAY SELL TOMORROW for 5%DON’T HAVE TIME TO MANAGE YOUR TRADES?
- Take BTST trades at 3:25 pm every day
- Try to exit by taking 4-7% profit of each trade
- SL can also be maintained as closing below the low of the breakout candle
Now, why do I prefer BTST over swing trades? The primary reason is that I have observed that 90% of the stocks give most of the movement in just 1-2 days and the rest of the time they either consolidate or fall.
Multiple Inside Bar in JINDDRILL
BUY TODAY SELL TOMORROW for 5%

Multi year breakout The stock has recently achieved a multi-year breakout, accompanied by substantial trading volumes. Additionally, it is displaying a rounding bottom pattern breakout with notable volume accumulation during the cup formation. The consolidation at the breakout level for approximately 2 months further adds to the positive signals.
These technical indicators collectively suggest a strong bullish momentum for the stock. Traders and investors often find such multi-faceted breakouts and consolidations compelling, as they may indicate sustained upward movement.
In summary, the multi-year breakout, rounding bottom pattern breakout with volume accumulation, and the period of consolidation contribute to a positive outlook. Market participants may anticipate a bullish momentum in the stock based on these technical signals.

Jindal Drilling - Long Setup, Move is ON...#JINDRILL trading above Resistance of 686
Next Resistance is at 1041
Support is at 421
Here are previous charts:
Chart is self explanatory. Levels of breakout, possible up-moves (where stock may find resistances) and support (close below which, setup will be invalidated) are clearly defined.
Disclaimer: This is for demonstration and educational purpose only. This is not buying or selling recommendations. I am not SEBI registered. Please consult your financial advisor before taking any trade.

Jindal Drilling - Long Setup, Move is ON...#JINDRILL trading above Resistance of 549
Next Resistance is at 686
Support is at 356.35
Here are previous charts:
Chart is self explanatory. Entry, Resistances and Support are mentioned on the chart.
Disclaimer: This is for demonstration and educational purpose only. This is not buying or selling recommendations. I am not SEBI registered. Please consult your financial advisor before taking any trade.

Ascending triangle breakout - JINDRILLPlease look into the chart for a detailed understanding.
Consider these for short-term & swing trades with 2% profit.
For BTST trades consider booking
target for 1%-2%
For long-term trades look out for resistance drawn above closing.
Please consider these ideas for educational purpose
Please note that, if there are some big targets, those are drawn thinking for long term.

Jindal Drill (WTF)ATH : 1089.29 dated: 14/1/2008
nearest target 824.45 dated 30/6/2008 which is next hurdle on WTF

Resuming uptrend 📌#Breakout Stock
JINDRILL
+ Resuming uptrend
+ Great volume Buildup
+ Strong relative Strength
+ Trading above Key EMAs

BUY TODAY SELL TOMORROW for 5%DON’T HAVE TIME TO MANAGE YOUR TRADES?
- Take BTST trades at 3:25 pm every day
- Try to exit by taking 4-7% profit of each trade
- SL can also be maintained as closing below the low of the breakout candle
Now, why do I prefer BTST over swing trades? The primary reason is that I have observed that 90% of the stocks give most of the movement in just 1-2 days and the rest of the time they either consolidate or fall
Trendline Breakout in JINDRILL
BUY TODAY SELL TOMORROW for 5%

Jindal Drilling and Industries LtdJINDRILL - Short term trade
Stong volume
Buy above 648 | Tgt 658, 670 |Sl 638
Its my view, trade on your analysis

JINDRILL - Ichimoku BreakoutStock Name - Jindal Drilling And Industries Limited
Ichimoku Cloud Setup :
1). Today's close is above the Conversion Line
2). Future Kumo is Turning Bullish
3). Chikou span is slanting upwards
All these parameters are showing bullishness at Current Market Price
and more bullishness AFTER crossing 640
#This is not Buy and Sell recommendation to any one. This is for education purpose and a helping hand to learn trading in Market.
#CloudTrading
#IchimokuCloud
#IchimokuFollowers
#Ichimokuexpert
I hope you all like my analysis.
Please do share your thoughts into comment section.
Please give a like, share & subscribe for daily analysis.

Inverted Head & Shoulder ⚠️Inverted Head & Shoulder
📌Beautiful Setup
✅Must add to your watchlist
JINDRILL
+ INH&S continuation pattern
+ Volume dry up
+ Trading above Key EMAs
📢 Look at the chart for more explanation
