Long JSWINFRA - Short term Investment# JSW Infrastructure Limited (NSE) - Technical Analysis Report
Current Price: 335.80
Key Technical Observations
**Bullish Breakout Setup**
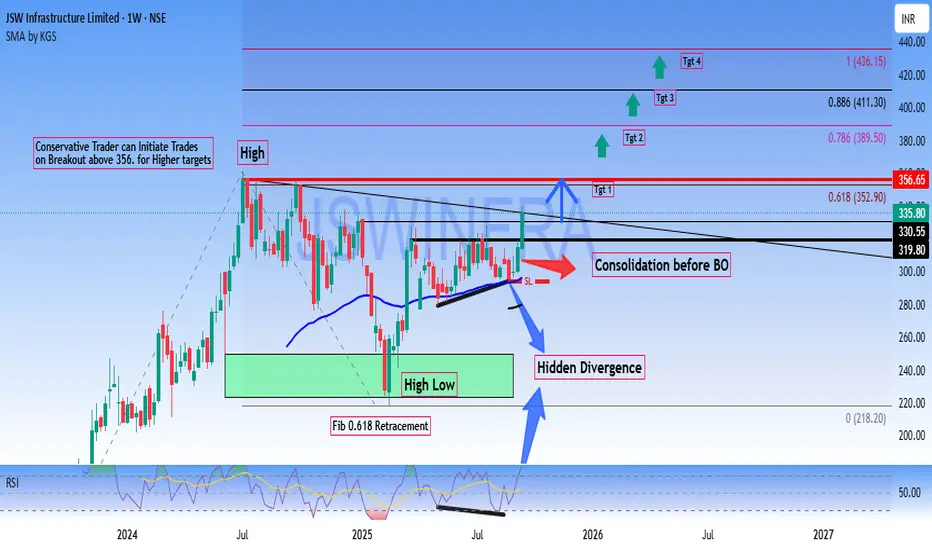
- Breakout Level: Above 356 for conservative trade
Consolidation phase completing before potential breakout (BO) & Stock trading near resistance zone.
Price Targets
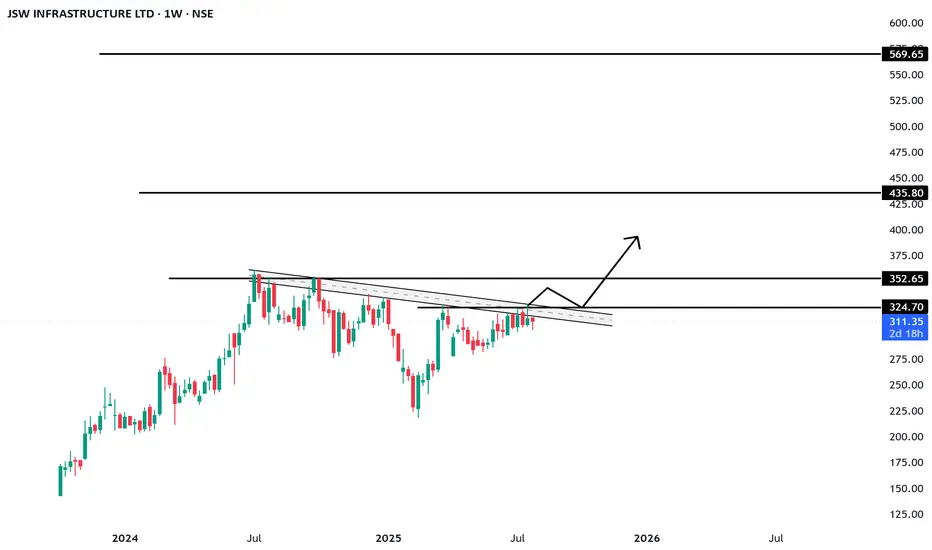
- Target 1: 352.90 (0.618 Fibonacci level)
- Target 2: 389.50 (0.786 Fibonacci level)
- Target 3: 411.30 (0.886 Fibonacci level)
- Target 4: 436.15 (1.0 Fibonacci extension)
- Moving Average: SMA showing upward momentum at 296.13
- Fibonacci Retracement : 61.8% level acting as immediate resistance
Chart Pattern Analysis
- Hidden Divergence on the chart suggesting underlying strength
- Consolidation Phase after pullback from 0.618 fib levels and Recent sideways movement indicating accumulation
Risk Management
- Support Level of the recent consolidation low around 280-300 zone
- Stop Loss: Conservative traders should consider stops below 320 on candle close basis.
Conservative Traders:
- Wait for decisive breakout above ₹356 with volume confirmation
- Enter on pullback to ₹340-345 range after breakout
- Target progressive profit booking at mentioned Fibonacci levels
Disclaimer: This analysis is for educational purposes only. Please conduct your own research and risk management before making investment decisions.
JSWINFRA trade ideas
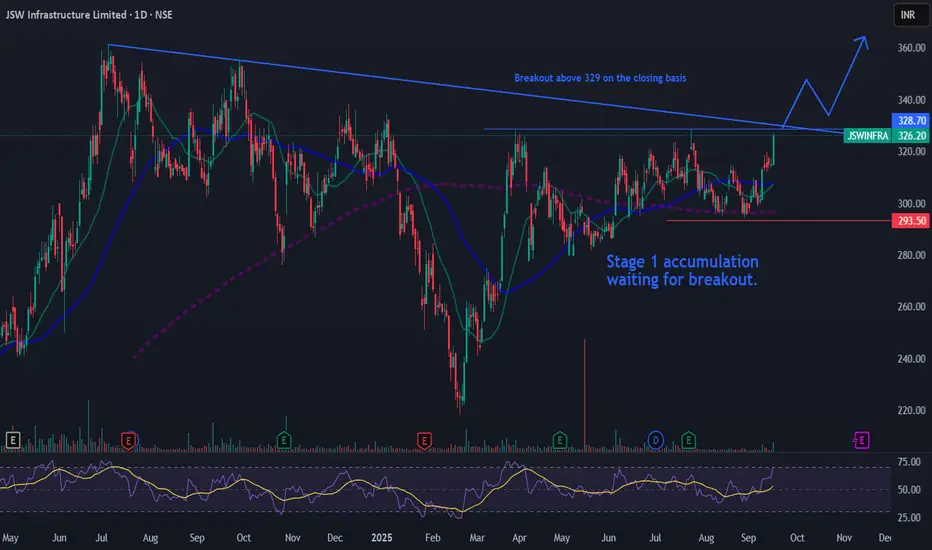
Jswinfra waiting for stage 1 breakoutJswinfra waiting for stage 1 breakout
Entry 329-340
SL 293
Only for journaling, not for a trading/investing.
This post is for my personal use.
Note : only for learning, not a trading recommendation. i am posting as a trading journal before and after breakout.
JSWINFRA – Potential Breakout Watch Price Action
CMP: ~₹335–336 (Sept 22, 2025)
The stock is in a strong, long-term uptrend and is currently consolidating near a key resistance level.
It is trading well above its 50-day and 200-day Simple Moving Averages, which confirms the long-term bullish trend.
Multiple technical patterns, including an "inverted Head and Shoulders," have been identified, suggesting a potential breakout is imminent.
Indicators & Momentum
RSI (14): ~74.00 → The RSI is in the overbought zone, which could lead to short-term consolidation before further upside.
ADX (14): ~23.93 → The ADX indicates a "Weak Trend," suggesting a recent period of consolidation, which is consistent with the price action.
EMAs: The price is trading well above its 50-day SMA (~₹309) and 200-day SMA (~₹297), with both acting as strong support levels.
Volume & Market Structure
The recent price surge has been backed by exceptionally high volume (over 10.4 million shares), a massive increase from the average daily volume of the previous week.
This volume-backed price action confirms strong buyer interest and accumulation.
Key Levels
Resistance: The immediate resistance is the recent high around ₹339.90. A break above this can lead to a test of the all-time high of ₹360.95. The neckline of the Inverted H&S pattern is at ₹330, which is a critical level to watch.
Support: The immediate support is the previous resistance zone around ₹325–₹330. Below that, the accumulation zone and EMA cluster around ₹290–₹300 provides a solid cushion.
Upside Targets
T1: ₹357
T2: ₹381
T3: ₹420+ (Extended swing target based on analyst reports)
Invalidation
Close below ₹320 = short-term caution and pattern failure.
Close below the 50-day SMA (~₹309) = medium-term weakness.
Trading View Bias
Bias: Bullish above ₹330
Short-Term: ₹357 → ₹381
Medium-Term: Potential for a move towards ₹420 and beyond.
Cautionary Note
This analysis is for informational and educational purposes only and should not be considered as financial advice. The stock market is highly volatile, and prices can change rapidly. All investment decisions carry a degree of risk.
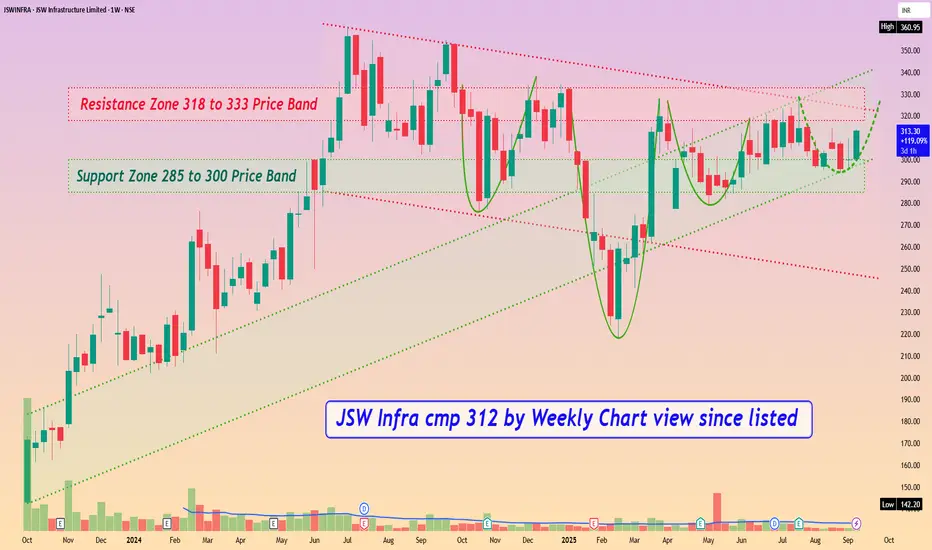
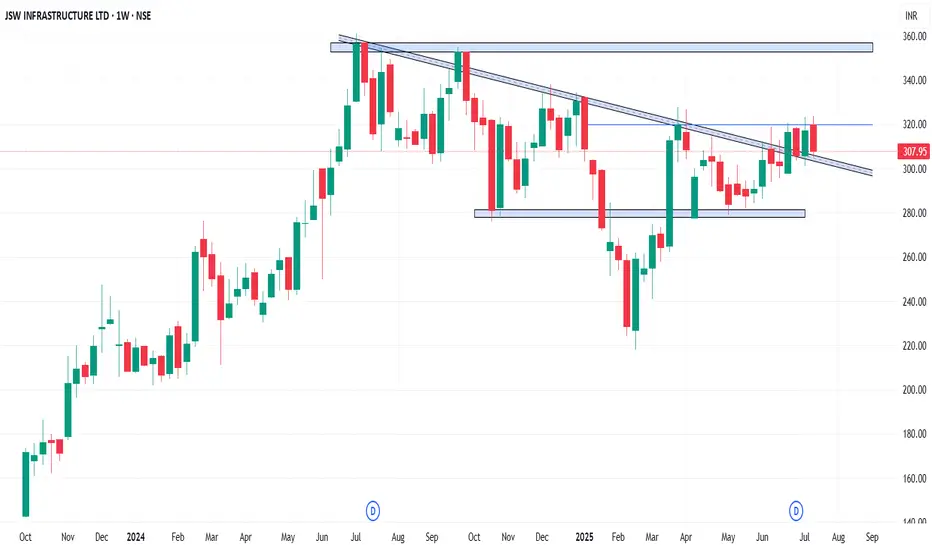
JSW Infra cmp 312 by Weekly Chart view since listedJSW Infra cmp 312 by Weekly Chart view since listed
- Support Zone 285 to 300 Price Band
- Resistance Zone 318 to 333 Price Band
- Bullish Rounding Bottoms repeated under the Resistance Zone neckline
- Stock making Higher High Lower High pattern within up-trending price channel momentum
- Stock traversing within Rising Support + Price Channel and attempting Falling Resistance + Price Channel Breakout
JSW-INFRA : Powering India’s Port Revolution – A Deep Dive into NSE:JSWINFRA
JSW Infrastructure Ltd.
🧾 Company Overview
Role: JSW Infrastructure is India's second-largest commercial port operator (after Adani Ports), and forms a core part of the JSW Group.
Operations: The company manages and operates major ports across both the east and west coastlines of India.
Revenue Streams: Primarily driven by port operations (handling bulk, breakbulk, containerized cargo), as well as integrated logistics services.
📊 FY24 Financial Snapshot
Revenue ₹3,200+Cr
EBITDA Margin 55–60%
Net Profit ₹750+Cr
Debt to Equity ~0.6x
ROCE ~15%
ROE ~13%
Positive aspects:
Asset Turnover Strong
Double-digit revenue CAGR (>20%) over the past three years.
High EBITDA margins consistent with best-in-class infra businesses.
Well-diversified cargo and customer profile, with increasing non-JSW business.
Stable long-term contracts & beneficiary of India’s logistics and trade reforms.
Risks / Weaknesses:
~70% revenue is from group companies, though diversification is underway.
Aggressive capex plans elevate financial risk.
Susceptible to regulatory, tariff, and environmental compliance changes.
📈 Technical Analysis (July 2025)
• Share Price: Trading in the ₹260–₹280 range. IPO was at ₹119 (Sep 2023); strong price appreciation since listing.
• Trend: Intact uptrend; recently consolidated between ₹240–₹260.
• Support/Resistance: Key support at ₹230–₹235; resistance at ₹285–₹300.
• Moving Averages: Stock remains above both its 50-EMA and 200-EMA — a structurally bullish indicator.
• Momentum:
o RSI: 60–65 (bullish, but approaching overbought)
o MACD: Fresh bullish crossover; volume shows accumulation near breakout.
• Outlook: Breakout above ₹285 could trigger medium-term upside toward ₹320–₹340. Buy-on-dips is favored, with strong accumulation likely in the ₹230–₹240 zone.
🚀 Growth Prospects & Strategic Moves
• Capacity Expansion: Plans to nearly double port capacity by FY30 (from ~160 MTPA to ~300 MTPA).
• Cargo Diversification: Targeting major reduction of group dependency (from ~70% to ~50%) by growing third-party cargo traffic.
• New Projects: Investment pipeline includes both greenfield and brownfield projects in Odisha, Maharashtra, and other states.
• Integrated Logistics: Deeper backward integration into rail connectivity and warehousing to capture higher value from logistics value chain.
• Macro Tailwinds
o Major government initiatives (e.g., Sagarmala) catalyzing sector growth.
o India’s trade/exports rising; strong outlook for cargo and container volumes.
o Shifts in supply chains to coastal shipping and blended logistics.
o Demand uptrend in containerization and warehousing services.
⚠️ Key Risks & Limitations
• High Capex Cycle: Expansion could elevate debt and financial leverage.
• Macro Sensitivity: Lower industrial/output growth would hit cargo volumes.
• Regulatory Overhang: Tariff and ESG regulations present chronic uncertainty.
• Group Concentration: Third-party cargo growth remains an execution challenge.
• Rivalry: Competitive intensity from Adani, DP World, and others is ramping up.
📌 Conclusion & Investment Verdict
Parameter Verdict
Fundamentals Strong, superior margins, efficient operations
Valuation Fair to premium (due to uptrend and growth)
Technical Trend Bullish, ready for potential breakout
Growth Outlook High (supported by sector tailwinds)
Risk Profile Moderate (driven by capex & regulatory factors)
For long-term investors:
JSW Infra presents a compelling case for portfolio inclusion, offering robust growth visibility, sectoral leadership, and operating excellence. Accumulation is best near ₹230–₹240 on dips.
Short-term view:
Stocks in strong uptrends may see minor corrections but are well-placed for fresh breakouts above ₹285, targeting ₹320–₹340.
The stock is ideal for investors seeking infrastructure-sector exposure with high growth potential, but one must remain mindful of execution and regulatory risks.
==============================
==============================
⚠️ Disclaimer:
This analysis is for educational and informational purposes only.
We are not SEBI-registered analysts or advisors.
This is our personal view based on available data and market trends.
Please consult your SEBI-registered investment advisor before making any investment or trading decisions.
You are solely responsible for any financial decisions you make based on this content.
========================
Trade Secrets By Pratik
========================
Update idea
Add note
Trade_Secrets_By_Pratik
Also on:
Disclaimer
The information and publications are not meant to be, and do not constitute, financial, investment, trading, or other types of advice or recommendations supplied or endorsed by TradingView. Read more in the Terms of Use.
English (India)
Select market data provided by ICE Data services.
Select reference data provided by FactSet. Copyright © 2025 FactSet Research Systems Inc.
© 2025 TradingView, Inc.
More than a product
Supercharts
Screeners
Stocks
ETFs
Bonds
Crypto coins
CEX pairs
DEX pairs
Pine
Heatmaps
Stocks
ETFs
Crypto
Calendars
Economic
Earnings
Dividends
More products
Yield Curves
Options
News Flow
Pine Script®
Apps
Mobile
Desktop
Tools & subscriptions
Features
Pricing
Market data
Trading
Overview
Brokers
Special offers
CME Group futures
Eurex futures
US stocks bundle
About company
Who we are
Athletes
Blog
Careers
Media kit
Merch
TradingView store
Tarot cards for traders
The C63 TradeTime
Policies & security
Terms of Use
Disclaimer
Privacy Policy
Cookies Policy
Accessibility Statement
Security tips
Bug Bounty program
Status page
Community
Social network
Wall of Love
Refer a friend
House Rules
Moderators
Ideas
Trading
Education
Editors' picks
Pine Script
Indicators & strategies
Wizards
Freelancers
Business solutions
Widgets
Charting libraries
Lightweight Charts™
Advanced Charts
Trading Platform
Growth opportunities
Advertising
Brokerage integration
Partner program
Education program
Look First
HDFC BANK LTD
NSE•Real-time•Market closed
Edit Idea
Minimize
Close
JSW INFRA : Powering India’s Port Revolution – A Deep Dive into
NSE:JSWINFRA
JSW Infrastructure Ltd.
🧾 Company Overview
Role: JSW Infrastructure is India's second-largest commercial port operator (after Adani Ports), and forms a core part of the JSW Group.
Operations: The company manages and operates major ports across both the east and west coastlines of India.
Revenue Streams: Primarily driven by port operations (handling bulk, breakbulk, containerized cargo), as well as integrated logistics services.
📊 FY24 Financial Snapshot
Revenue ₹3,200+Cr
EBITDA Margin 55–60%
Net Profit ₹750+Cr
Debt to Equity ~0.6x
ROCE ~15%
ROE ~13%
Positive aspects:
Asset Turnover Strong
Double-digit revenue CAGR (>20%) over the past three years.
High EBITDA margins consistent with best-in-class infra businesses.
Well-diversified cargo and customer profile, with increasing non-JSW business.
Stable long-term contracts & beneficiary of India’s logistics and trade reforms.
Risks / Weaknesses:
~70% revenue is from group companies, though diversification is underway.
Aggressive capex plans elevate financial risk.
Susceptible to regulatory, tariff, and environmental compliance changes.
📈 Technical Analysis (July 2025)
• Share Price: Trading in the ₹260–₹280 range. IPO was at ₹119 (Sep 2023); strong price appreciation since listing.
• Trend: Intact uptrend; recently consolidated between ₹240–₹260.
• Support/Resistance: Key support at ₹230–₹235; resistance at ₹285–₹300.
• Moving Averages: Stock remains above both its 50-EMA and 200-EMA — a structurally bullish indicator.
• Momentum:
o RSI: 60–65 (bullish, but approaching overbought)
o MACD: Fresh bullish crossover; volume shows accumulation near breakout.
• Outlook: Breakout above ₹285 could trigger medium-term upside toward ₹320–₹340. Buy-on-dips is favored, with strong accumulation likely in the ₹230–₹240 zone.
🚀 Growth Prospects & Strategic Moves
• Capacity Expansion: Plans to nearly double port capacity by FY30 (from ~160 MTPA to ~300 MTPA).
• Cargo Diversification: Targeting major reduction of group dependency (from ~70% to ~50%) by growing third-party cargo traffic.
• New Projects: Investment pipeline includes both greenfield and brownfield projects in Odisha, Maharashtra, and other states.
• Integrated Logistics: Deeper backward integration into rail connectivity and warehousing to capture higher value from logistics value chain.
• Macro Tailwinds
o Major government initiatives (e.g., Sagarmala) catalyzing sector growth.
o India’s trade/exports rising; strong outlook for cargo and container volumes.
o Shifts in supply chains to coastal shipping and blended logistics.
o Demand uptrend in containerization and warehousing services.
⚠️ Key Risks & Limitations
• High Capex Cycle: Expansion could elevate debt and financial leverage.
• Macro Sensitivity: Lower industrial/output growth would hit cargo volumes.
• Regulatory Overhang: Tariff and ESG regulations present chronic uncertainty.
• Group Concentration: Third-party cargo growth remains an execution challenge.
• Rivalry: Competitive intensity from Adani, DP World, and others is ramping up.
📌 Conclusion & Investment Verdict
Parameter Verdict
Fundamentals Strong, superior margins, efficient operations
Valuation Fair to premium (due to uptrend and growth)
Technical Trend Bullish, ready for potential breakout
Growth Outlook High (supported by sector tailwinds)
Risk Profile Moderate (driven by capex & regulatory factors)
For long-term investors:
JSW Infra presents a compelling case for portfolio inclusion, offering robust growth visibility, sectoral leadership, and operating excellence. Accumulation is best near ₹230–₹240 on dips.
Short-term view:
Stocks in strong uptrends may see minor corrections but are well-placed for fresh breakouts above ₹285, targeting ₹320–₹340.
The stock is ideal for investors seeking infrastructure-sector exposure with high growth potential, but one must remain mindful of execution and regulatory risks.
==============================
==============================
⚠️ Disclaimer:
This analysis is for educational and informational purposes only.
We are not SEBI-registered analysts or advisors.
This is our personal view based on available data and market trends.
Please consult your SEBI-registered investment advisor before making any investment or trading decisions.
You are solely responsible for any financial decisions you make based on this content.
========================
Trade Secrets By Pratik
========================
JSWINFRA - Weekly AnalysisIn the Weekly Chart of JSWINFRA ,
we can see that, it has given Cup & Handle failure at 320 Level.
Also we can see that 320 has been tested multiple times, anything above 320 will be bullish.
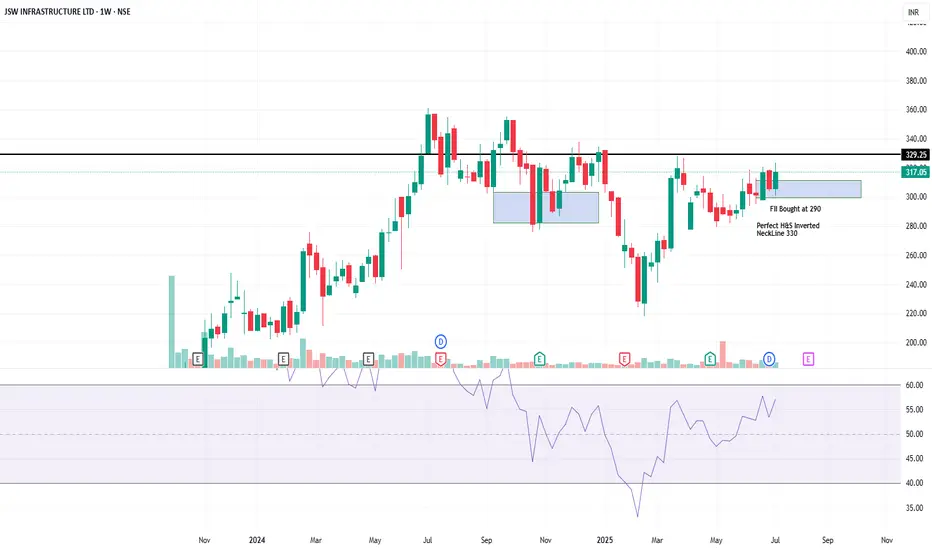
JSWINFRA Weekly Reserch AnalysisChart Pattern: Inverted Head and Shoulders (H&S) Pattern Identified
Neckline Resistance: ₹330
FII Accumulation Zone: Around ₹290
Price Action: Price has formed a classic inverted H&S pattern and is currently consolidating just below the neckline at ₹330.
Volume: Rising volume indicates institutional interest.
Conclusion:
=====================
A weekly close above ₹330 may lead to a bullish breakout.
Target levels post-breakout could be in the range of ₹360-₹390 short term, with medium-term potential above ₹400 if volume supports.
Shareholding & Institutional Activity
=========================================
FII Holding Zone: ₹290
High Institutional Interest: Visible from both volume and price breakout attempts.
Retail Participation: Healthy based on consolidation and absorption of supply.
Financial Analysis
====================
Company has demonstrated robust earnings growth and excellent cost management.
Strong operating leverage.
JSW INFRAs very well consolidated making higher lows with a proper Fibonacci retracement of 0.618 , which is an ideal correction. the stock is on the verge of breakout and have attempted breakout . if breakout happens with volume stock can go past 370 .
Recently stock has won port project in Kolkata and today it got an approval for railway infra in NCR.
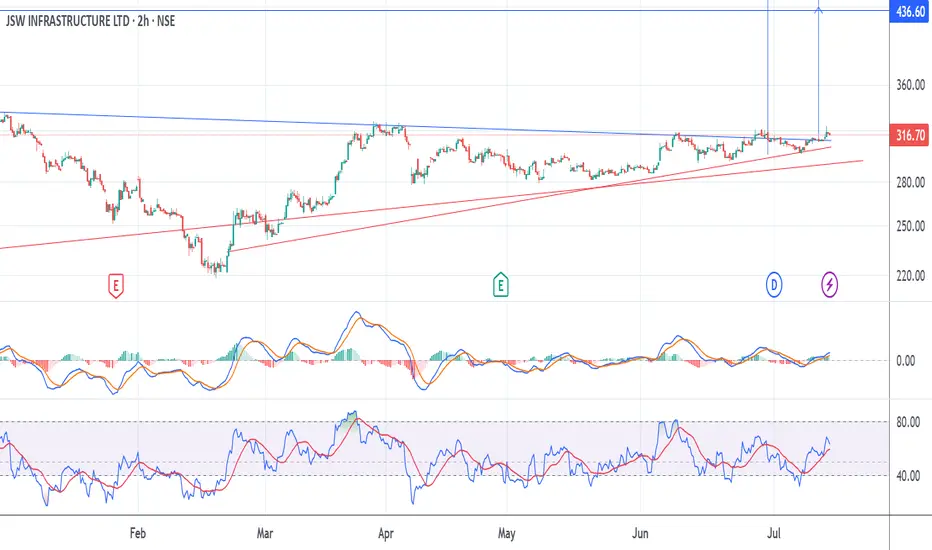
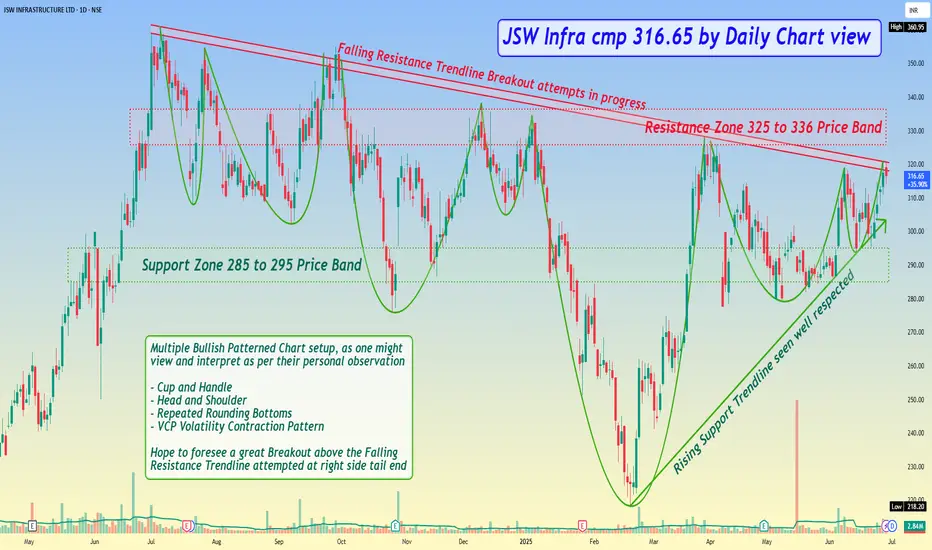
JSW Infra cmp 316.65 by Daily Chart view*JSW Infra cmp 316.65 by Daily Chart view*
- Support Zone 285 to 295 Price Band
- Resistance Zone 325 to 336 Price Band
- Rising Support Trendline seen well respected
- Falling Resistance Trendline Breakout attempts in progress
- [ b]Multiple Bullish Patterned Chart setup, as one might view and interpret as per their personal observation
- Cup and Handle
- Head and Shoulder
- Repeated Rounding Bottoms
- VCP Volatility Contraction Pattern
- [ b]Hope to foresee a great Breakout above the Falling Resistance Trendline attempted at right side tail end
JSW Infra - MULTIPLE PATTERN BREAKOUTJSW Infra Fundamentally is going strong business !!
Y-on-Y strong growth and super Margins.
Fii is slowly increasing Stake as well!!
Indicators are supporting in a strong way as well!
Buy @ 315
SL 286
Target - 360 ++
A good bet for short Term !!
JSWENERGY – Breakout Watch Near ₹307JSWENERGY has been consolidating in a tight range between ₹298–₹307 after a previous dip, and is now showing signs of a potential breakout setup.
🔍 Key Observations:
📉 After a sharp correction, price found support near ₹300 and has since been trading sideways.
📊 Multiple bounces from ₹300–₹301 show strong buyer interest at that zone.
🔼 ₹305–₹307 remains a stiff resistance; price needs to break this zone with volume for upside momentum.
🔕 Volume has remained low during this consolidation, which is typical before a breakout move.
✅ Bullish Scenario (65% Probability)
🔔 Trigger: Breakout above ₹307 with high volume
🎯 Target 1: ₹315
🎯 Target 2: ₹325
🔒 Stop-loss: Below ₹298
❌ Bearish Scenario (35% Probability)
🔻 Trigger: Breakdown below ₹298
🎯 Target 1: ₹290
🎯 Target 2: ₹280
📌 Trading Plan:
Wait for a breakout above ₹307 with volume. Ideal setup would be a breakout and retest of the ₹305–₹307 zone, followed by momentum continuation. Avoid pre-emptive entries inside the range.
💬 What do you think — will the ₹307 barrier break this week?
Drop your views, chart setups, or alternate levels in the comments!
#JSWENERGY #BreakoutSetup #TechnicalAnalysis #StockMarketIndia #SwingTrading #PriceAction #TradingViewIndia #EnergyStocks
JSW Infrastructure Ltd. – Strong Q4 Boost as it Eyes Breakout📈Technical Analysis
IPO & Rally: Since its listing on October - 2023 at ₹140–150, the stock surged to ₹360 by July 2024.
Correction & Support: A pullback followed, finding solid demand at ₹220, which held firm.
Recent Rally: Strong Q3 and Q4 2024 results triggered a rebound starting February 2025.
Resistance Zone: The stock now faces resistance at the ₹320 area, aligned with recent lower highs.
Higher Volume: A surge in trading volume on 5th June confirmed investor interest.
Breakout Signal: If JSW Infra breaks above ₹320 and retests it as support with bullish candlestick confirmation, it may rally further.
🎯 Targets: ₹340 → ₹360 → ₹380
🔻 Supports: ₹280 → ₹220 (major demand zone)
Caution Alert: A failure to hold above these supports could trigger further downside.
💰Q4 FY24 Key Financial Highlights:
Total Income: ₹1,283 Cr (vs ₹1,182 Cr in Q3 FY24; ₹1,096 Cr in Q4 FY23)
Total Expenses: ₹642 Cr (vs ₹596 Cr in Q3 FY24; ₹515 Cr in Q4 FY23)
Total Operating Profits: ₹641 Cr (vs ₹586 Cr in Q3 FY24; ₹581 Cr in Q4 FY23)
Profit Before Tax: ₹581 Cr (vs ₹276 Cr in Q3 FY24; ₹417 Cr in Q4 FY23)
Profit After Tax: ₹516 Cr (vs ₹336 Cr in Q3 FY24; ₹329 Cr in Q4 FY23)
Diluted Normalized EPS: ₹2.43 (vs ₹1.57 in Q3 FY24; ₹1.57 in Q4 FY23)
📌All major metrics show strong sequential growth, demonstrating robust quarterly momentum.
🔍Fundamental Insights
Revenue Growth: Q4 FY25 saw a 17% YoY increase to ₹1,283 Cr
Profit Surge: Net profit jumped 57% YoY to ₹516 Cr
Operating Margin: EBITDA rose 7% YoY to ₹730 Cr, with margin at 39%
Cargo Volume: Handled 31.2 million tonnes in Q4 FY25 — up 5% YoY; third-party cargo share reached 50% from 47%
Dividend Declared: ₹0.80 per share for Q4 FY25, showcasing shareholder returns
Strategic Projects: Interim operations began at Tuticorin & JNPA terminals, reinforcing growth in coal & logistics verticals
Industry Edge: Heavy reliance on bulk cargo provides resilience against global container market volatility
🧭Conclusion
JSW Infrastructure is fundamentally and technically well-positioned after its strong Q4 showing:
🔹 Key Watchpoint: Break above ₹320 and retest as support.
🔹 Bullish Scenario: Sustained move may target ₹340 → ₹360 → ₹380.
🔹 Bearish Signal: Failure to hold ensuing supports (₹280 / ₹220) could lead to correction.
Disclaimer: lnkd.in
JSW Infrastructure Ltd. – Strong Q4 Boost as it Eyes Breakout📈 Technical Analysis
IPO & Rally: Since its listing on October - 2023 at ₹140–150, the stock surged to ₹360 by July 2024.
Correction & Support: A pullback followed, finding solid demand at ₹220, which held firm.
Recent Rally: Strong Q3 and Q4 2024 results triggered a rebound starting February 2025.
Resistance Zone: The stock now faces resistance at the ₹320 area, aligned with recent lower highs.
Higher Volume: A surge in trading volume on 5th June confirmed investor interest.
Breakout Signal: If JSW Infra breaks above ₹320 and retests it as support with bullish candlestick confirmation, it may rally further.
🎯 Targets: ₹340 → ₹360 → ₹380
🔻 Supports: ₹280 → ₹220 (major demand zone)
Caution Alert: A failure to hold above these supports could trigger further downside.
💰 Q4 FY24 Key Financial Highlights:
Total Income: ₹1,283 Cr (vs ₹1,182 Cr in Q3 FY24; ₹1,096 Cr in Q4 FY23)
Total Expenses: ₹642 Cr (vs ₹596 Cr in Q3 FY24; ₹515 Cr in Q4 FY23)
Total Operating Profits: ₹641 Cr (vs ₹586 Cr in Q3 FY24; ₹581 Cr in Q4 FY23)
Profit Before Tax: ₹581 Cr (vs ₹276 Cr in Q3 FY24; ₹417 Cr in Q4 FY23)
Profit After Tax: ₹516 Cr (vs ₹336 Cr in Q3 FY24; ₹329 Cr in Q4 FY23)
Diluted Normalized EPS: ₹2.43 (vs ₹1.57 in Q3 FY24; ₹1.57 in Q4 FY23)
📌All major metrics show strong sequential growth, demonstrating robust quarterly momentum.
🔍 Fundamental Insights
Revenue Growth: Q4 FY25 saw a 17% YoY increase to ₹1,283 Cr
Profit Surge: Net profit jumped 57% YoY to ₹516 Cr
Operating Margin: EBITDA rose 7% YoY to ₹730 Cr, with margin at 39%
Cargo Volume: Handled 31.2 million tonnes in Q4 FY25 — up 5% YoY; third-party cargo share reached 50% from 47%
Dividend Declared: ₹0.80 per share for Q4 FY25, showcasing shareholder returns
Strategic Projects: Interim operations began at Tuticorin & JNPA terminals, reinforcing growth in coal & logistics verticals
Industry Edge: Heavy reliance on bulk cargo provides resilience against global container market volatility
🧭 Conclusion
JSW Infrastructure is fundamentally and technically well-positioned after its strong Q4 showing:
🔹 Key Watchpoint: Break above ₹320 and retest as support.
🔹 Bullish Scenario: Sustained move may target ₹340 → ₹360 → ₹380.
🔹 Bearish Signal: Failure to hold ensuing supports (₹280 / ₹220) could lead to correction.
⚠️ Disclaimer
This information is for educational purposes only. It is not investment advice. Please consult with professional advisors before making any decisions.
JSW Infrastructure got a huge volume transaction. Long probableA super huge volume transaction has happened in JSW infra. It has formed flag and pole pattern in recent times breakout from the pattern has a probable upside with significant return.
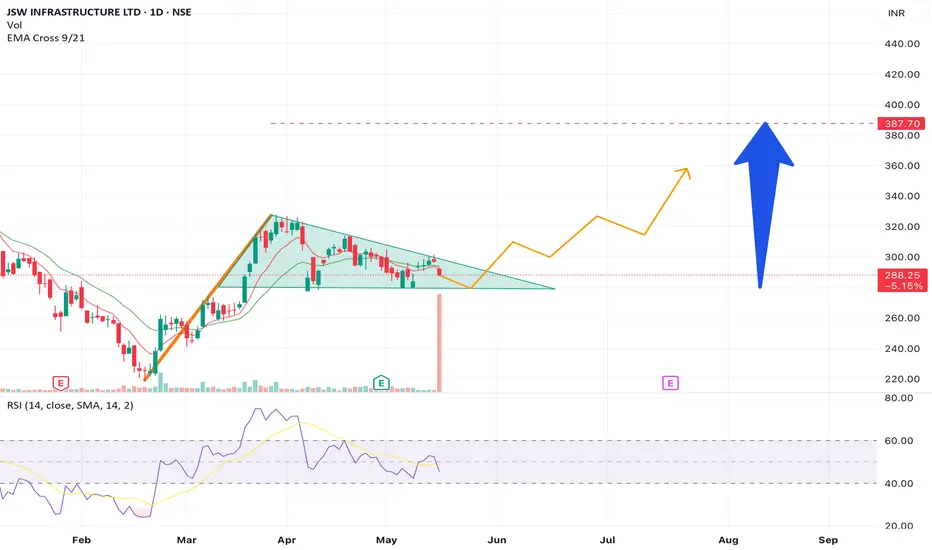
20% TechnoFunda IdeaFundamental:
The company has shown a good profit growth of 42.63% for the Past 3 years. The company has shown a good revenue growth of 18.61% for the Past 3 years. The Company has been maintaining an effective average operating margins of 45.17% in the last 5 years. Company's PEG ratio is 0.56.
Technical:
Its a Type 2 Trade with the marking of Wave 4c,its all set for a Wave 5 rally.
Formation of a Bullish Pennant is there with a support on its 200 Dma.
A positive close above 297 (SL290) will trigger a BUY for a target of 340-360 levels.

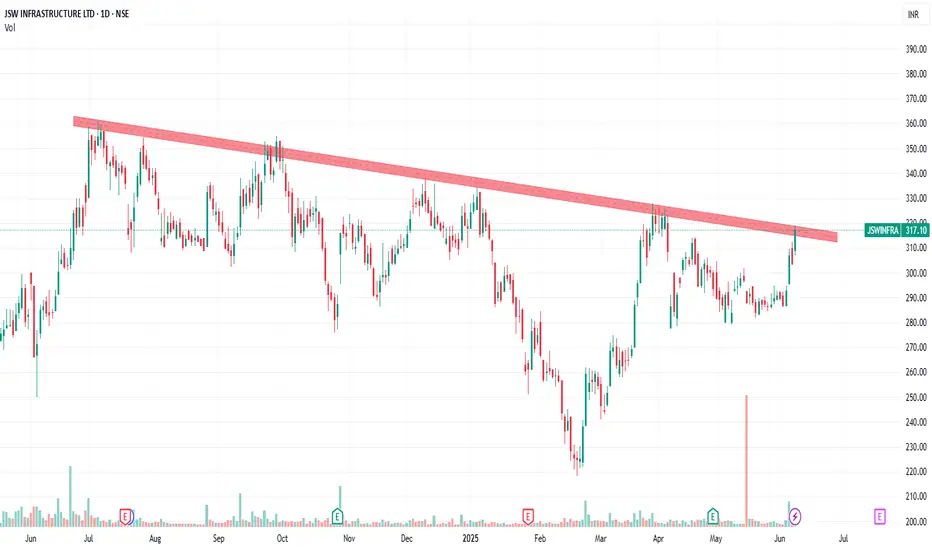
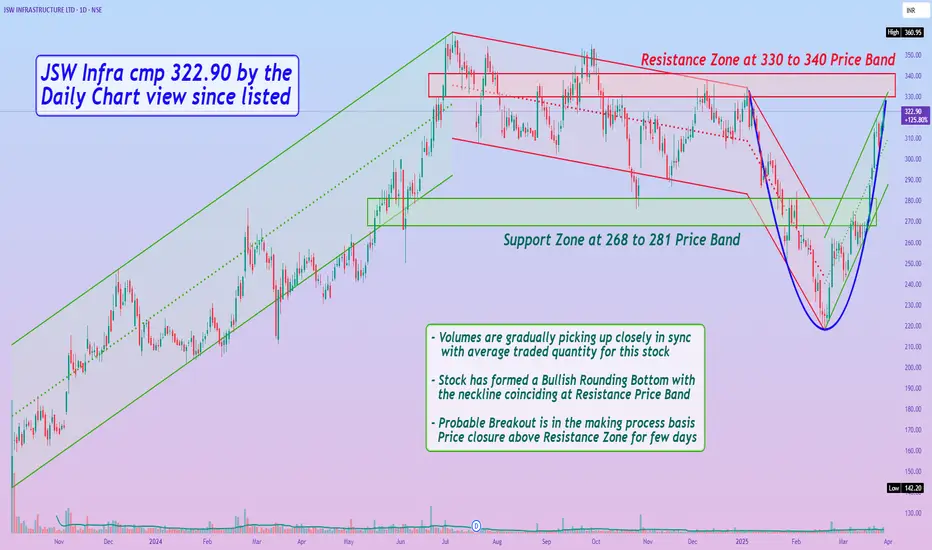
JSW Infra cmp 322.90 by the Daily Chart view since listedJSW Infra cmp 322.90 by the Daily Chart view since listed
- Support Zone at 268 to 281 Price Band
- Resistance Zone at 330 to 340 Price Band
- Volumes are gradually picking up closely in sync with average traded quantity for this stock
- Stock has formed a Bullish Rounding Bottom with the neckline coinciding at Resistance Price Band
- Probable Breakout is in the making process basis Price closure above Resistance Zone for few days
"JSW Infra: Climbing the Crane of Success!""JSW Infra: Sailing Toward the Fibonacci 0.618 Dock! 🚢📈"
This means the stock is likely retracing to the golden ratio (61.8%) level, a key Fibonacci retracement point often seen as strong support or resistance in technical analysis.
🚨 Disclaimer: Not Financial Advice! 🚨
** This is for educational purposes only! 📚😂 Do your own research, consult a professional, and remember—stocks can go up, down, or sideways faster than your morning coffee spills! ☕📉📈 Invest responsibly! 🚀💸 **

Long run in JWS infra there can be a momentum in JSW infra
potential 10% of move could be seen in upcoming month if index remains strong

JSW INFRA : Breakout or VCP formation#JSWINFRA #breakoutsoon #Vcppattern #swingtrade
JSWINFRA : Breakout or VCP Formation - there are 2 scenarios
Breakout Scenario :
>> Enter with 30% of position Sizing now
>> If Breakout happens u wont be in FOMO
>> If Breakout Sustains u can add more win Retest or Retracement
>> Swing Traders can look to book close to 10 % profits
VCP Formation :
>> Enter 30% position sizing now
>> If it starts falling, Its a Confirmation of VCP formation
>> Start Accumulatig during the Downpart of VCP
>> when VCP upside Starts it can Give Good Spike
>> In Case of VCP Breakout, Swing Traders can Look to target min 10-15% profits.
I want you all to Observe this stock setup and see what scenario plays out.
If u Like the Setup & analysis, Pls give us a Boost, Comment & Follow us
Disc : Charts Shared are for Educational purpose, so that u can Learn how to analyse Stocks and How u can plan ur Entries etc. Do not take position in it unless u consult ur Financial advisor also do ur own analysis

JSW infra Two possible entries for decent gains.Two possible entries after retests on breakouts on ATH or at the recent swing fib retracement

JSW INFRA BULLISH VIEW. Market Cap
₹ 74,067 Cr.
Current Price
₹ 353
High / Low
₹ 361 / 142
Stock P/E
65.8
Book Value
₹ 38.2
Dividend Yield
0.16 %
ROCE
16.4 %
ROE
19.0 %
Face Value
₹ 2.00

JSW INFRA READY TO FORM A MORNING STAR PATTERNJSW INFRA READY TO FORM A MORNING STAR PATTERN,It is consolidating at support level.

JSW Infrastructure Ltd Support & Resistance #JSWINFRA 👑👑
Trendline breakout candidate.
Looks good if holds well above 355
For JSW Infrastructure Ltd. (JSWINFRA), here are the current support and resistance levels based on recent technical analysis:
Support Levels:
S1: 320.43
S2: 316.27
S3: 312.33
Resistance Levels:
R1: 328.53
R2: 332.47
R3: 336.631
