JTEKT India Technical AnalysisHere's a comprehensive TradingView report for JTEKT India Limited:
Current Price:160.90
📊 TECHNICAL SETUP OVERVIEW
JTEKT India is displaying a compelling technical structure within a well-defined ascending channel pattern that has been in play since the 2020 lows. The stock is currently consolidati
JTEKT India Limited
No trades
Next report date
—
Report period
—
EPS estimate
—
Revenue estimate
—
2.67 INR
752.63 M INR
23.98 B INR
77.92 M
About JTEKT India Limited
Sector
Industry
CEO
Minoru Sugisawa
Website
Headquarters
Gurugram
Founded
1984
Identifiers
2
ISININE643A01035
JTEKT India Ltd. engages in business of manufacturing and assembling of automotive components. Its product includes steering, bearing, and machine tools. It operates through the India and Abroad geographical segments. The company was founded by Surinder Kapur on June 14, 1984 and is headquartered in Gurugram, India.
Related stocks

BUY TODAY SELL TOMORROW for 5%DON’T HAVE TIME TO MANAGE YOUR TRADES?
- Take BTST trades at 3:25 pm every day
- Try to exit by taking 4-7% profit of each trade
- SL can also be maintained as closing below the low of the breakout candle
Now, why do I prefer BTST over swing trades? The primary reason is that I have observed that

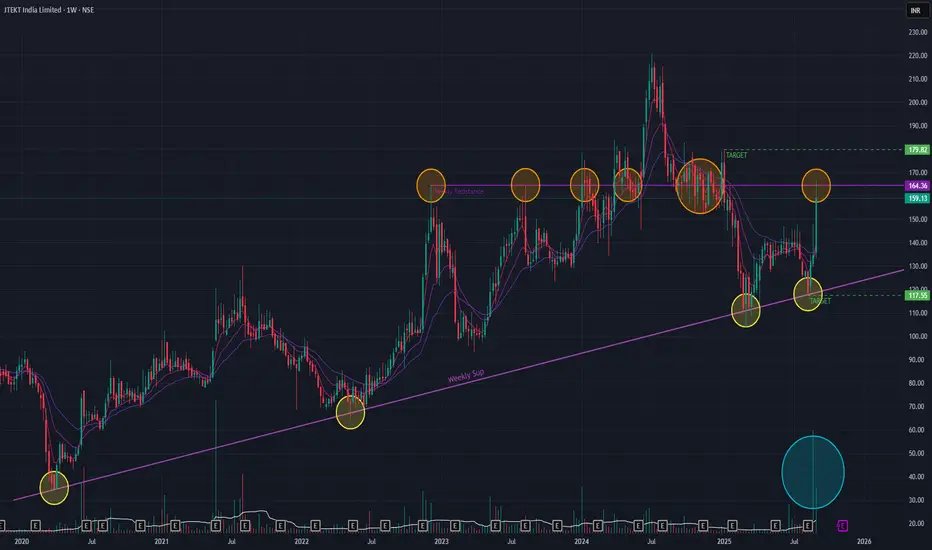
JTEKT India Ltd (Weekly Timeframe) - Potential ATH ??JTEKT is on an uptrend and have been respecting the support trendline as indicated. Since Dec 2022, the stock made several attempts to BreakOut of a major resistance zone and was successful once in Breaking Out and making an All Time High (ATH) in Jun 2024. As of last week the stock surged by 18+ %
How to Talk to Charts & Paint Price Action | TradingView IndiaStop treating charts like raw data. In this TradingView India tutorial, learn how to talk to charts by drawing levels, zones, and patterns on a blank canvas—transforming price into actionable art. Perfect for beginners and pros looking to visualize market structure and make smarter trades

JTEKINDIA to take long entryWatch the stock of JTEKINDIA taking 50 EMA support every time on the weekly chart. This time, the stock is also trading in the same area. There is a very high probability that the stock will bounce back from the current levels. If in the coming days, the stock shows the volumes. A very good risk to

JTEKT 1DBOS (Break of Structure):
A break of structure occurred in the uptrend, signalling a shift in market momentum around late April to early May. This indicates that the previous resistance was broken, which led to a strong bullish rally.
CHOCH (Change of Character):
After the bullish move, a change o

STOCK ON TRENDLINE SUPPORTThe stock is currently at the support level with the trendline.
Look out for a bullish signal.
The stock can go upto the levels of:
1. 180
2. 195
3. 200
NOTE - Analyse yourself before investing.
HAPPY TRADING!

JTekt : Strong BounceJtekt India :
Looks like there is a reversal on cards, taking strong support.
Stay long above 182.5 with support at 169

Jtekt India ltd . Looking good and up for another upward move.The rising wedge pattern has been made on this stock and has given decent returns now it's ready for another upward movement.
Disclaimer: this is just for educational purposes.

JTEKTINDIA - RARE CHART WITH 6 CONTRACTIONS & BREAKOUTHi All,
This idea is about JTEKT India Ltd
Fundamentals
Market Cap - 5661 Cr
Stock PE - 55
ROE - 13.6%
ROCE - 17.3%
Promoter Holding - 75%
MktCap/Sales - 2.5
Quick Ratio - 1.12
D/E - 0.14
Technicals
Rarely it is observed that a stock goes through 6 contractions before going for a breakout from

See all ideas
Summarizing what the indicators are suggesting.
Neutral
SellBuy
Strong sellStrong buy
Strong sellSellNeutralBuyStrong buy
Neutral
SellBuy
Strong sellStrong buy
Strong sellSellNeutralBuyStrong buy
Neutral
SellBuy
Strong sellStrong buy
Strong sellSellNeutralBuyStrong buy
An aggregate view of professional's ratings.
Neutral
SellBuy
Strong sellStrong buy
Strong sellSellNeutralBuyStrong buy
Neutral
SellBuy
Strong sellStrong buy
Strong sellSellNeutralBuyStrong buy
Neutral
SellBuy
Strong sellStrong buy
Strong sellSellNeutralBuyStrong buy
Displays a symbol's price movements over previous years to identify recurring trends.
Frequently Asked Questions
The current price of JTEKTINDIA is 144.13 INR — it has decreased by −0.99% in the past 24 hours. Watch JTEKT India Limited stock price performance more closely on the chart.
Depending on the exchange, the stock ticker may vary. For instance, on NSE exchange JTEKT India Limited stocks are traded under the ticker JTEKTINDIA.
JTEKTINDIA stock has risen by 0.39% compared to the previous week, the month change is a −6.72% fall, over the last year JTEKT India Limited has showed a −8.53% decrease.
We've gathered analysts' opinions on JTEKT India Limited future price: according to them, JTEKTINDIA price has a max estimate of 192.00 INR and a min estimate of 148.00 INR. Watch JTEKTINDIA chart and read a more detailed JTEKT India Limited stock forecast: see what analysts think of JTEKT India Limited and suggest that you do with its stocks.
JTEKTINDIA reached its all-time high on Jul 3, 2024 with the price of 220.81 INR, and its all-time low was 1.37 INR and was reached on Mar 8, 1999. View more price dynamics on JTEKTINDIA chart.
See other stocks reaching their highest and lowest prices.
See other stocks reaching their highest and lowest prices.
JTEKTINDIA stock is 2.79% volatile and has beta coefficient of 1.50. Track JTEKT India Limited stock price on the chart and check out the list of the most volatile stocks — is JTEKT India Limited there?
Today JTEKT India Limited has the market capitalization of 40.35 B, it has decreased by −2.51% over the last week.
Yes, you can track JTEKT India Limited financials in yearly and quarterly reports right on TradingView.
JTEKT India Limited is going to release the next earnings report on Feb 5, 2026. Keep track of upcoming events with our Earnings Calendar.
JTEKTINDIA net income for the last quarter is 182.28 M INR, while the quarter before that showed 108.16 M INR of net income which accounts for 68.53% change. Track more JTEKT India Limited financial stats to get the full picture.
Yes, JTEKTINDIA dividends are paid annually. The last dividend per share was 0.70 INR. As of today, Dividend Yield (TTM)% is 0.48%. Tracking JTEKT India Limited dividends might help you take more informed decisions.
JTEKT India Limited dividend yield was 0.58% in 2024, and payout ratio reached 24.17%. The year before the numbers were 0.34% and 14.28% correspondingly. See high-dividend stocks and find more opportunities for your portfolio.
As of Dec 24, 2025, the company has 3.44 K employees. See our rating of the largest employees — is JTEKT India Limited on this list?
EBITDA measures a company's operating performance, its growth signifies an improvement in the efficiency of a company. JTEKT India Limited EBITDA is 1.77 B INR, and current EBITDA margin is 7.73%. See more stats in JTEKT India Limited financial statements.
Like other stocks, JTEKTINDIA shares are traded on stock exchanges, e.g. Nasdaq, Nyse, Euronext, and the easiest way to buy them is through an online stock broker. To do this, you need to open an account and follow a broker's procedures, then start trading. You can trade JTEKT India Limited stock right from TradingView charts — choose your broker and connect to your account.
Investing in stocks requires a comprehensive research: you should carefully study all the available data, e.g. company's financials, related news, and its technical analysis. So JTEKT India Limited technincal analysis shows the sell today, and its 1 week rating is sell. Since market conditions are prone to changes, it's worth looking a bit further into the future — according to the 1 month rating JTEKT India Limited stock shows the neutral signal. See more of JTEKT India Limited technicals for a more comprehensive analysis.
If you're still not sure, try looking for inspiration in our curated watchlists.
If you're still not sure, try looking for inspiration in our curated watchlists.