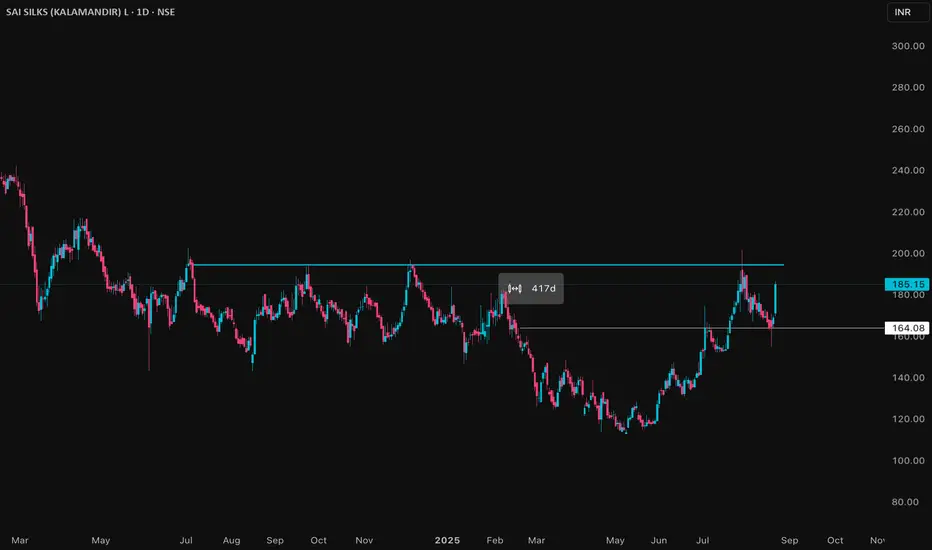
KALAMANDIR Price ActionKalamandir Industries (Sai Silks) is currently trading around ₹165–₹185 as of August 2025. The stock has seen a significant recovery in recent months after reaching lows near ₹113 in the past year. It is trading close to its 52-week high of about ₹201, indicating strong bullish momentum.
The company operates in the textile and garment retail sector, with a focus on silk and ethnic wear. Revenue growth has been moderate, with recent quarterly financials showing steady improvement in sales and profit margins, driven by an uptick in both retail and wholesale demand.
Valuation wise, the stock has a price-to-earnings (PE) ratio around 22–23, reflecting moderate market expectations for growth. The price-to-book (PB) ratio stands near 2.2, indicating a fair premium over book value.
Volume patterns show increased trading activity near current price levels, confirming investor interest. The stock is currently in a consolidation phase after a strong rally, with support around ₹150 and resistance near the recent highs at ₹200.
In summary, Kalamandir Industries is positioned for potential upside with improving fundamentals and positive technical momentum. Investors should monitor key support and resistance levels for entry or profit-taking decisions.
Trade ideas
BUY TODAY SELL TOMORROW for 5%DON’T HAVE TIME TO MANAGE YOUR TRADES?
- Take BTST trades at 3:25 pm every day
- Try to exit by taking 4-7% profit of each trade
- SL can also be maintained as closing below the low of the breakout candle
Now, why do I prefer BTST over swing trades? The primary reason is that I have observed that 90% of the stocks give most of the movement in just 1-2 days and the rest of the time they either consolidate or fall
Trendline Breakout in HERANBA
BUY TODAY SELL TOMORROW for 5%
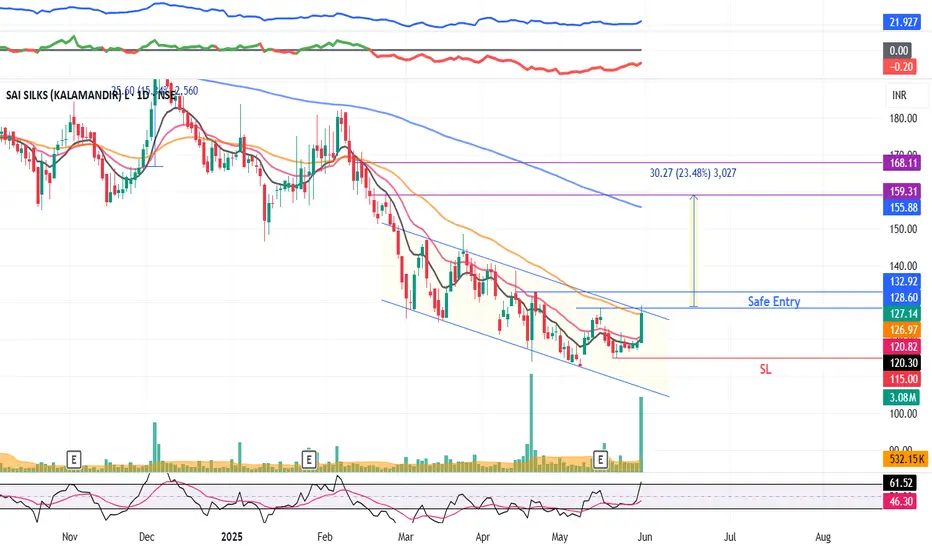
KALAMANDIR : Falling Channel pattern#KALAMANDIR #chartpatterntrading #fallingchannelpattern #channelbreakout #breakoutstock
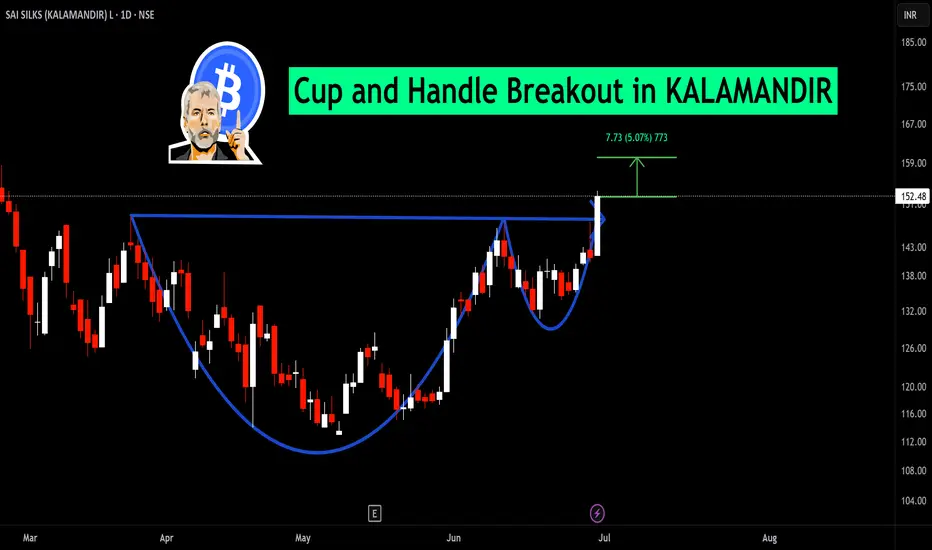
KALAMANDIR : Swing Trade
>> Breakout stock
>> Falling Channel pattern breakout
>> Good Strength & Volume Buildup
>> Stock in Momentum
Swing Traders can lock profits @10% & keep trailing
Disc : Stock Charts shared are for Learning purpose, not a Trade recommendation
Consult a SEBI Registered Advisor before taking position in it.
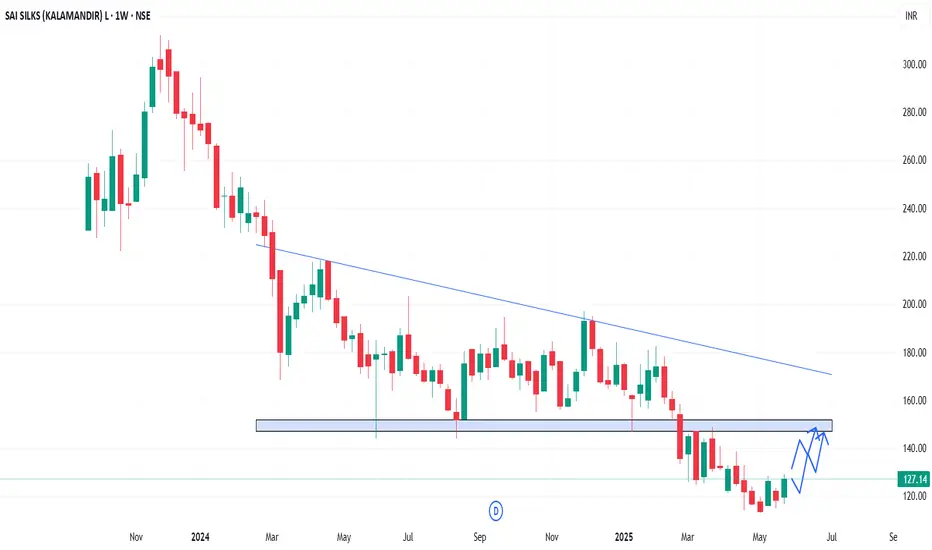
KALAMANDIR - Weekly AnalysisIn the Weekly Chart of KALAMANDIR ,
we can see that; it can create a Bullish momentum from here.
Possible momentums are shown in chart.
KALAMANDIR SYMMETRICAL TRIANGLE BREAKOUTThis stock has broken the symmetrical triangle pattern in weekly TF. In the last quarter FII's increased their holdings in this stock,so expected to go up in coming weeks.

Kalamandir looks very attractive, High Risk - Reward SetupFundamentals : Decent, Consistent growth on Sales, Profits and EPS. High Reserves (recently doubled) vs Debt. DII stake increasing.
Technicals : Bearish, Risky, Very attractive RR. Trendline support. Below listing price!
R 1: 220 (Trend reverse level)
R 2: 250
R 3: 290
Support Zone : 150-160

KALAMANDIR Chart : Bullish for long termKALAMANDIR chart is looking bullish from current market price, observe this chart for educational purpose

IPO BASE BREAKOUT 📌SWING TRADE FOR NEXT WEEK🚀
Hello guys,
I am a swing trader by passion i only trade on swing stocks.
📌I post daily SWING CHARTS analysis on my trading view profile..
so let's start
📌TRADE ANALYSIS OF SAI SILK :-
•IPO base Trade
•Volume contract
•Bullish trend/ make good structure also
•Made good price action
•Make higher highs/higher lows
📌 If you have any questions about any stock you can comment on post 📱
📌Disclaimer:-
This all chatrs analysis are only for educational purposes only
I do not provide any CALL or Tips
